Categories Stocks
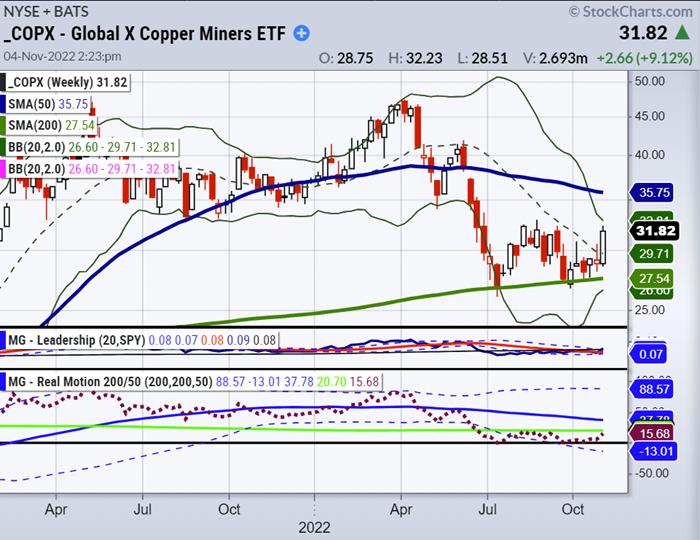
Copper Breaks with an Outsized Move
November 5, 2022
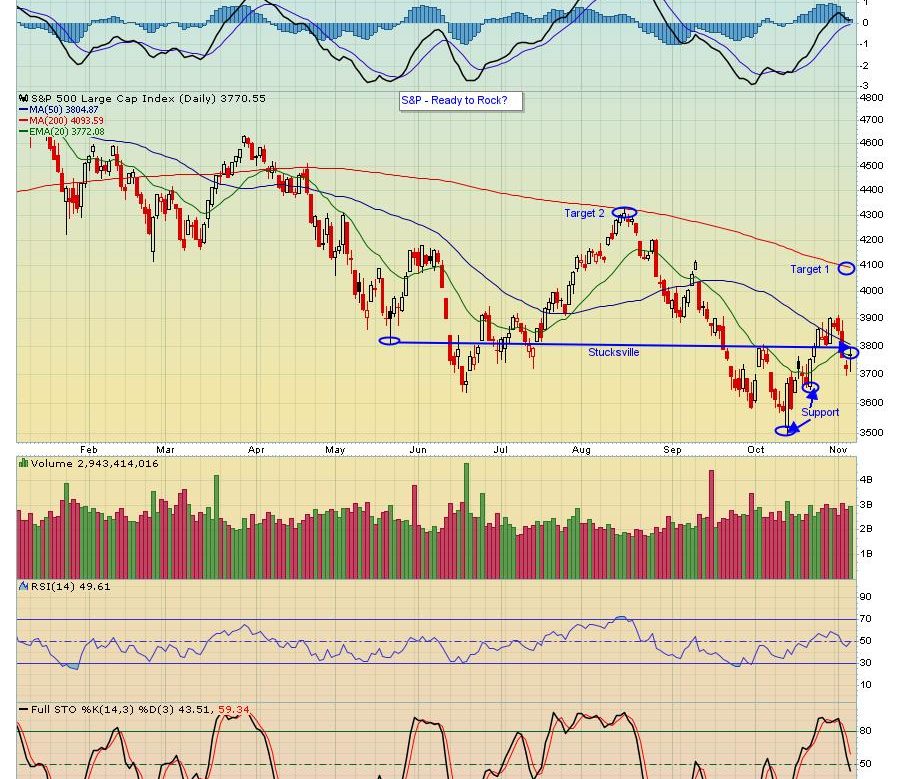
The S&P 500 moved to a new low from June to October, but copper held up better with a higher low and