
I know we’re in the midst of a powerful rally that began EXACTLY when seasonality suggested it would – at the close on October 27th. I discussed the very bearish seasonality leading up to that October 27th close in my article, “Odds Favor Further Selling This Week (Maybe a LOT of it)”. Check it out if you haven’t already. At the end of this article, I pointed out that bullish historical tendencies would soon overpower the bears and we’ve seen history repeat itself once again as the bulls have dominated the bears during the latter part of October and throughout November.
Technical Price Action
Before I provide more bullish historical tendencies ahead, let’s look at the S&P 500 over multiple time frames:
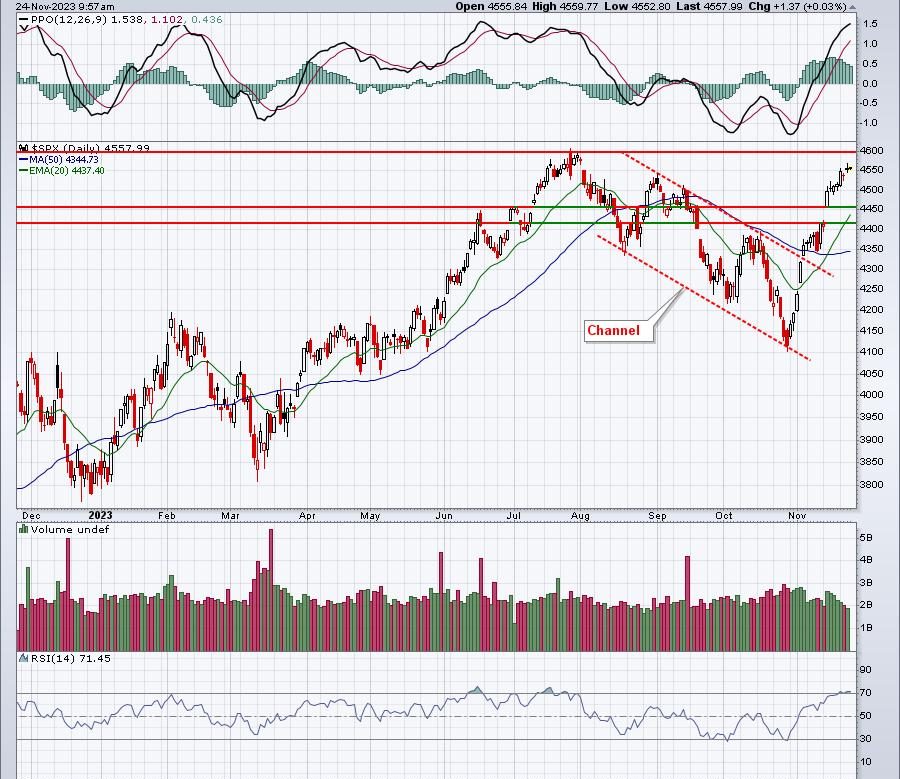
S&P 500 – 1 Year Daily:
Pretty simple. We had a correction. The downtrend was broken. We’re now trending higher with approaching price resistance near 4600. To the downside, a gap support zone resides from 4411-4559 and the rising 20-day EMA is conveniently located in the middle of it at 4437.
S&P 500 – 5 Years Weekly:
Sure looks like a bullish inverse head & shoulders continuation pattern to me. The pattern is almost perfectly symmetrical and it follows a very clear uptrend. The beauty here is that the pattern measurement is from the 4600 neckline down to the inverse head just below 3500. That’s 1100 points. A breakout above 4600 would measure up 1100 points to 5700. Good luck bears! During uptrends, the RSI tends to hold the 40-50 range. Note the October low was squarely on 40. Now the RSI is back above 60. This is how the RSI unfolds during bull market advances. I also love the PPO reset at the zero line. We’re now moving straight up off of that test, and that’s indicative of accelerating bullish momentum.
S&P 500 – 40 Years Monthly:
Do you see anything other than an uptrend? The red-shaded areas highlight what we typically see during secular (long-term) bear markets. From 2000 to 2013, we saw ZERO meaningful breakouts. It wasn’t until April 10th, 2013 that the secular bull market began, making a definitive breakout above the 1550-1575 area. Since then, we’ve seen cyclical bear markets and corrections, but nothing more. Yet permabears try to call every downturn the beginning of the next collapse. And they’re always wrong. We’ll have scary times again, but it ain’t now – at least not in my opinion. The 2030s could be a much different story, but I see the current trend higher continuing for a number of years. Note that our monthly PPO typically remains above zero and our monthly RSI remains above 40 throughout secular bull markets. Selling doesn’t last long enough to take these indicators below the required zero and 40 levels, respectively. But we have to deal with the “sky is falling!” media and permabears throughout. If you need a “default”, default as a bull. You’ll be right much more often.
Historical Tendencies
We remain in the strongest and most bullish time of the calendar year, which I define as October 27th close through January 18th close. That’s based on my 73 years of research on the S&P 500, dating back to 1950. We still have some not-so-bullish periods during November, December, and January, but the overwhelming bias is to the upside. For instance, the November 21st through December 6th period yields an annualized return of +32.97% over the past 7 decades, nearly quadrupling the average annual S&P 500 return of +9.00%. Don’t misunderstand me. This doesn’t guarantee us higher prices for the next couple weeks. Instead, it’s simply providing us a seasonal tendency for stock prices to move higher. I use seasonality as a secondary indicator, much like PPO and RSI. The primary indicator is always price action.
I’m still offering my FREE PDF, “Bowley Trend Part 1: Long-Term Trends Since 1950”. I use it to help guide me in my trading. You probably don’t realize it, but there’s an 11-day period of EVERY calendar month (THE SAME DAYS EVERY SINGLE MONTH), or roughly 33% of all calendar days, that has provided more than 80% of the S&P 500 gains since 1950. As a stock trader, and especially if you trade options, you MUST know these days to get a leg up on everyone else. CLICK HERE to download your FREE COPY immediately!
Happy trading!
Tom