
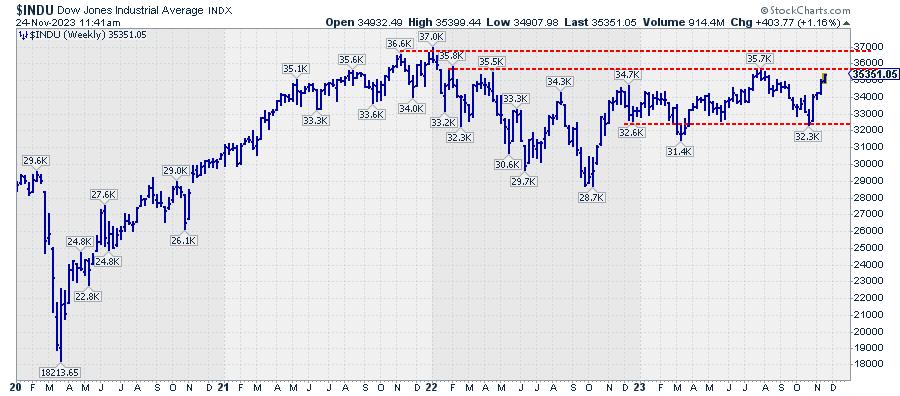
The Dow Jones Industrial Index is reaching overhead resistance between 35.5k and 35.7k. This means that upside potential is now limited. And even when the market manages to break that area, the next resistance level is already around 37k.
However, the relative rotation graph showing the rotation for all 30 members of the DJ Industrials Index shows some potentially very interesting pair trade setups.
DJ Industrials
On the weekly chart above, that overhead resistance area is clearly visible. The previous highs, which define the resistance zone, date back to late 2021 and early 2022, almost two years ago. This makes it a very important resistance zone.
An upward break of that resistance will obviously be a very bullish signal. But the recent rally, coming out of the late October low, has been very steep, and it would not be strange to see some form of consolidation against the aforementioned resistance zone.
With overhead resistance nearby, the near-term risk is now to the downside. Looking at the chart a setback after a peak against resistance could take the Dow as low as 32.3k. This would still keep $INDU within the boundaries of this year’s trading range.
Opposite Tails On Weekly RRG
The weekly relative rotation graph above shows the rotations for all thirty stocks inside the Dow Jones Industrial Index. With the benchmark index still inside a trading range, some of the opposite rotations that are visible on the graph suggest that a few interesting pair trading opportunities are present.
In order to clean up the RRG and put emphasis on the more interesting rotations, I have taken out the tails with less favorable characteristics.
In order to see if I could get confirmation, I have run the same RRG on the daily time frame.
Given the current rotational patterns, many different pair trading opportunities can be found. I encourage you to do your own research and find out whether you have a particularly strong view of specific stocks or combinations of stocks, positive or negative.
I will pick two examples of potential pair trades from the RRGs above and look at the individual charts.
NKE vs CAT
On the weekly RRG, Nike and Caterpillar’s tails rotate in opposite directions. NKE is inside the improving quadrant and rapidly heading toward leading. CAT is inside the weakening quadrant and rapidly heading toward lagging. Both tails are at the extremes of the RRG and far away from the benchmark. This indicates a big potential for alpha.
NKE
NKE is nearing resistance between 110 and 115, suggesting that there is limited upside potential left, unless NKE can clear this barrier in the coming weeks.
However, as we are looking for pair trades, we need to focus more on the relative strength conditions. And these are clearly picking up for NKE.
The JdK RS-Momentum line is already well above 100 and is dragging the JdK RS-Ratio line higher. When both RRG-Lines are moving up at the same time, this causes an RRG-heading between 0-90 degrees which we know is an indication of strength.
CAT
On the price chart, CAT has just bounced off its rising support line. The relative performance, however, is not looking that good.
The JDK RS-momentum line already dropped below 100 a few weeks ago and is now rapidly dragging the RS-Ratio line lower.
This rapid decline in relative strength suggests a further underperformance for CAT in the next few weeks.
Off-setting the relative strength of NKE against the relative weakness of CAT makes for a potentially interesting pair-trading opportunity.
MSFT vs MRK
The weekly RG details for Microsoft and Merck show opposite rotational patterns. MSFT has just completed a rotation from leading through weakening and is now back into leading, making it one of the strongest stocks, if not the strongest, in this universe.
The opposite goes for the tale of MRK. This one rotated from lagging into improving and is now crossing back into the lagging quadrant.
We know that rotations that complete on one side of the graph indicate a new Up- or Down-leg in an already established up or down trend.
MSFT
The recent break to new all-time highs is holding up well. It has also caused the raw RS-line to push to new highs where it is also holding. This is a strong combination of facts.
After a brief dip below 100, the JdK RS-Momentum line has now crossed back above that level again, dragging the RS-ratio out of its low just above 100. This causes the tail on the RRG to push back into the leading quadrant at a strong RRG-heading.
The combination of strong relative strength and a break to new highs on the price chart makes Microsoft the best chart in this universe for the time being.
MRK
MRK reached its all-time high in May of this year but has been in a steady downtrend since then. The Price Of Merck reached support just above 100 a few weeks ago and is still hovering slightly above that area at the moment. A break lower will very likely accelerate the decline, very likely, toward the next level of support between 92.50 and 95.
The raw rs line is breaking an important horizontal support level completing a topish formation. The RRG lines already picked up on the new downtrend in July. The recent hiccup of the RS-Momentum line above 100 is the result of the sideways consolidation of relative strength above support.
With raw RS, breaking support, and the RS momentum line dropping below 100, both RRG-Lines are now once again moving lower while below 100. This causes the tail on the RRG to move deeper into the lagging quadrant while traveling at a negative heading.
Both tails completing a rotation at the same side of the RRG suggests a continuation of the ongoing outperformance of MSFT over MRK.
Enjoy your ThanksGiving weekend but #StayAlert, –Julius