
I love the seasonality information that StockCharts.com provides. It’s important to keep in mind that seasonal tendencies are secondary indicators. I don’t buy and sell based on them, because the price/volume combination will always be my primary indicator. But if technical indications point to higher prices and seasonality supports this technical thought process, then my confidence in a strategy or individual trade soars. I want to first take a trip down memory lane. I always shake my head when the “Go Away in May” crowd begins to chant in late April. In case you weren’t watching, the S&P 500 gained ground in 2023 AFTER these chants as follows:
May 2023: +0.25%June 2023: +6.47%July 2023: +3.11%
It’s only 10% return roughly (sarcasm). History, if you actually study it, suggests the true “go away” period to be July 17th through September 26th.
The 2023 gains on the NASDAQ have been even more impressive:
May 2023: +5.80%June 2023: +6.59%July 2023: +4.05%
That’s over a 16% return in just 3 months! “Go away in May” at your own risk.
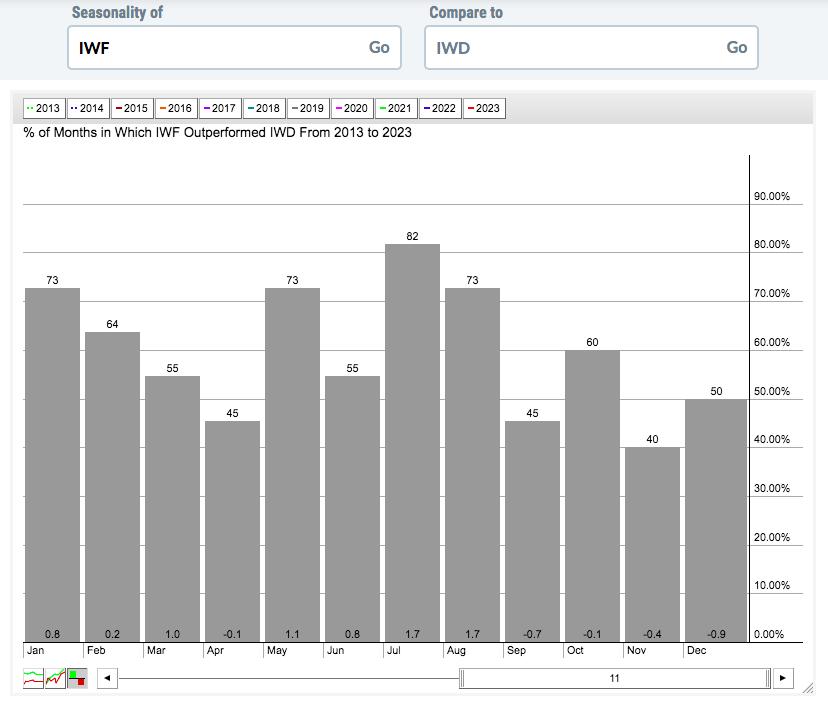
One important piece of history I shared with EarningsBeats.com members several months ago was the relative strength in growth stocks (IWF) vs. value stocks (IWD) from May through August. The “Go away in May” crowd totally misses the BEST four consecutive months of relative outperformance of growth stocks, which I find sad. Check out this relative seasonal chart of the IWF vs. the IWD since this secular bull market started in 2013:
It takes just a moment to break those average monthly returns into three periods as follows:
January through April: +1.9%May through August: +5.3%September through December: -2.1%
Growth stocks PUMMEL value stocks from May through August (paying attention “Go away in May” folks?), after outperforming during the first 4 months of the year. But September 1 is when seasonal winds tend to blow from the other direction. Those final 4 months tend to result in underperformance of growth stocks.
Here’s the last year’s chart, which shows that this IWF:IWD relationship has followed the historical pattern to a “T”:
While growth stocks have experienced a significant absolute and relative run to the upside in 2023, it makes sense to at least consider the possibility that winds will soon be blowing from a different direction.
There’s one value stock in particular that would absolutely LOVE this shift in wind direction as it’s ready to advance from a technical perspective and it LOVES the end of the year historically. In fact, it’s averaged gaining 10.5% in Q4 alone since the secular bull market began in 2013! I’ll feature it in our FREE EB Digest newsletter on Tuesday morning before the market opens. If you’d like to receive it and you aren’t already an EB Digest subscriber, simply CLICK HERE and sign up by entering your name and email address. That’s all it takes! There’s no credit card required and you can unsubscribe at any time.
Happy trading!
Tom