
Week Ahead: Corrective Undertone To Persist So Long As Nifty Below These Levels; These Sectors To Stay Resilient
In a week that has gone by, Indian equities continued to heavily consolidate. They defended key levels for most of the week; it was in the last two trading sessions that the markets came off from their high point while giving up all their weekly gains. The trading range got wider on the anticipated lines. As compared to a 228-point range in the week before this one, NIFTY found itself oscillating in a 354-point range over the past five sessions. Despite giving up the gains from the week’s high point, the headline index went on to close with a negligible loss of 44.35 points (-0.23%) on a weekly basis.
The past week was important from a technical perspective. On the daily chart, the NIFTY has seemingly broken down from a not-so-classical bearish Head & Shoulders formation. This is a small formation, not a very potent one, as it is not visible on the weekly chart. However, the important thing is that after defending the 50-DMA for four days, the NIFTY finally gave up and closed below this 50-DMA which is currently placed at 19374. This action has dragged the resistance point for the markets lower between the 19400-19500 zone. All technical pullbacks, as and when they occur, will find themselves capped in this zone.
The volatility remained unchanged; while staying much towards one of its lowest levels seen in the recent past, INDIAVIX declined marginally by just 0.49% to 12.08. The coming week is likely to see a quiet start. Nifty is likely to see the levels of 19410 and 19490 acting as resistance points. The supports come in at 19110 and 18900 levels.
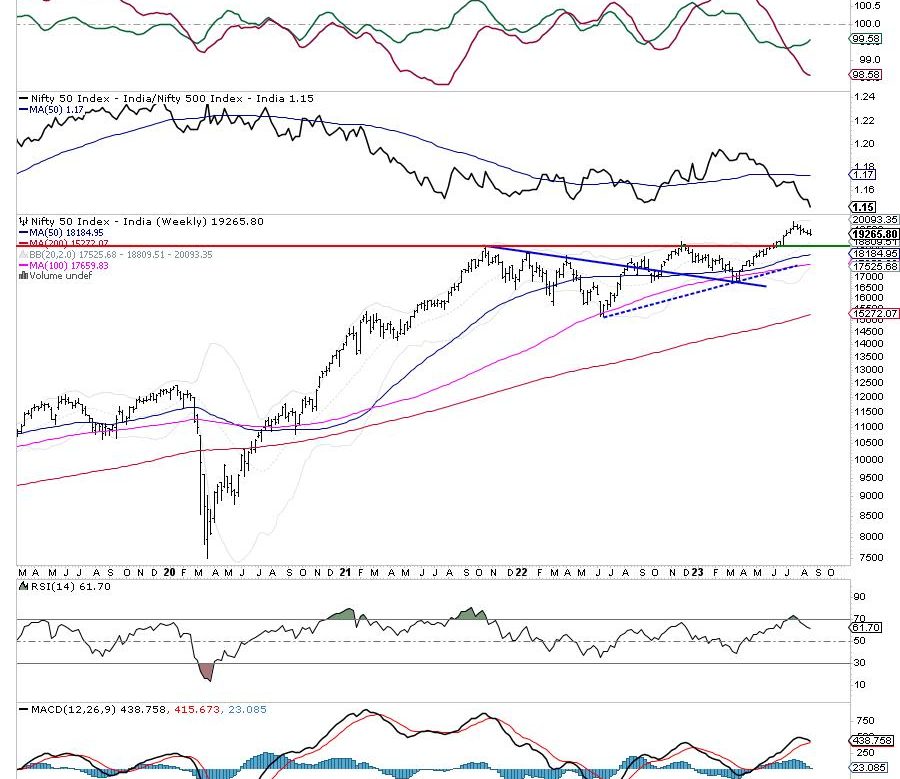
The weekly RSI is 61.70; it stays neutral and does not show any divergence against the price. The weekly MACD is bullish and stays above the signal line. However, the sharply narrowing Histogram suggests that it may be moving towards a negative crossover in the coming days.
The pattern analysis shows that the NIFTY staged a breakout by moving past the previous high point. This breakout was achieved as the index moved past the 18900 level; it went on to form a high at 19991 following which it is presently witnessing corrective retracement. The most immediate support is at 18900; if Nifty tests this level, it may achieve a full throwback by retesting the breakout point. While the NIFTY has violated the 50-DMA on the daily chart, it trades comfortably above all key moving averages on the weekly chart.
All in all, the coming week is likely to be a tricky one; the markets may continue to display a corrective undertone on one hand, and on the other, we may see some strong improvement in the sectors that are either low beta or considered traditionally defensive. We are expected to see pockets like IT, Energy, PSE, etc. doing well. Some risk-off approach is likely to be visible and the sessions may also stay influenced by the rollover-centric activity due to the monthly derivatives expiry slated to come up later next week. It is recommended to continue staying highly stock-specific and selective in approach while maintaining a cautious approach for the coming week.
Sector Analysis for the coming week
In our look at Relative Rotation Graphs®, we compared various sectors against CNX500 (NIFTY 500 Index), which represents over 95% of the free float market cap of all the stocks listed.
The analysis of Relative Rotation Graphs (RRG) shows that the Nifty PSE Sector and Energy indexes have rolled inside the leading quadrant. Besides this, Nifty Media, Metal, Pharma, PSU Bank, and Midcap100 sectors are inside the leading quadrant. These groups are likely to relatively outperform the broader NIFTY 500 Index. The Nifty Infrastructure Index is on the verge of rolling inside the weakening quadrant.
The Nifty Realty Index has rolled inside the weakening quadrant. The Consumption and Auto sectors are inside the weakening quadrant.
The Nifty Services sector, Banknifty, and Financial Services index are inside the lagging quadrant. The FMCG index has also rolled inside the lagging quadrant.
The Nifty Commodities is also on the verge of rolling inside the weakening quadrant again. Besides this, Nifty IT has rolled inside the improving quadrant and may begin relatively outperform the broader markets.
Important Note: RRG™ charts show the relative strength and momentum of a group of stocks. In the above Chart, they show relative performance against NIFTY500 Index (Broader Markets) and should not be used directly as buy or sell signals.
Milan Vaishnav, CMT, MSTA
Consulting Technical Analyst