
Hopeful Market Breadth Signs Emerge; Smart Money Flows into New Sectors, Watch QQQ and NVDA
After all the drama over the preceding days, the takeaways from Mr. Powell’s Jackson Hole speech were ultimately pretty straightforward:
Even though the Fed will be data-dependent on its future interest rate decisions, the data, until proven otherwise, says inflation remains a problem;And that means that there may be more rate hikes.
Stocks got the message and delivered a relief rally. The market’s breadth improved, while asset rotation was evident.
Housing Sector Feels the Bond Market’s Pinch
I remain long-term bullish on homebuilders and expect a major buying opportunity in the sector will eventually materialize. But for now, patience is required.
Last week in this space, I noted: “We may have seen the top in the housing stocks, although the jury is still out on this. I’ve been bullish on homebuilders for quite a long time, but, unless something improves quickly, the best days for this group may be behind us.”
Regular readers might have been surprised about my change in viewpoint, given my long-term bullish stance on the homebuilders. As I’ve stated here multiple times, the sector has one big long term positive going for it; tight housing supplies. But the short-term looks choppy.
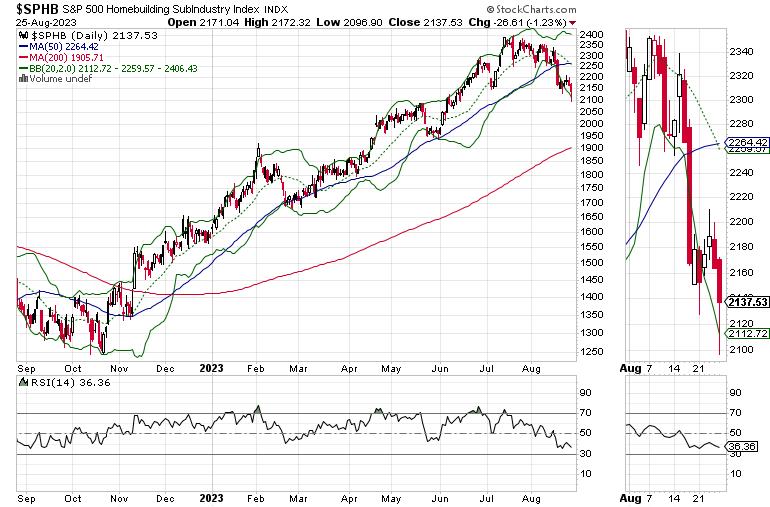
Again, I want to be clear on this. The long-term trend for the homebuilders (SPHB) remains up. The S&P Homebuilders Sector Index (SPHB) is trading well above its 200-day moving average. Yet the macro effects of higher bond yields and their reflection in higher mortgage rates will likely weigh on the homebuilder stocks for the intermediate-term.
The composite chart of the homebuilder sector vs. mortgage rates (Mortgage) and the U.S. Ten Year Note yield (TNX) shows the nearly perfect relationship between the three indicators, as SPHB rolled over when TNX crossed above 4% and the average mortgage rate first approached 7%.
Apartment REITs Are Attracting Smart Money
Certainly, things could change, but, for now, the smart money is flowing away from homebuilders into the apartment rental REIT sector as tight housing supplies, the ongoing migration to the sunbelt, and stable-to-lower rents are not changing but interest rates are pushing buyers to the sidelines.
So, while homebuilder stocks sagged after Mr. Powell’s speech, the iShares Residential Real Estate ETF (REZ) held above its recent bottom. Note the bullish uptick in On Balance Volume (OBV) indicating that stealthy smart money is moving in.
Another important area of the market to watch is the tech sector, especially the AI stocks. The market initially rallied on Nvidia’s (NVDA) bullish earnings and outlook, but pulled back as the good news about AI could well be factored in. Note the emerging downslope in Accumulation/Distribution and the flattening-out of On Balance Volume (OBV) for NVDA. These are signs that short sellers are building positions (ADI) and sellers are overtaking buyers (OBV).
On the other hand, the Invesco QQQ Trust (QQQ) may have made a short-term bottom, which will be worth watching. Certainly, a sustained recovery in tech will bode well for stocks.
Finally, as I’ve noted here over the last few weeks, despite the notion that the global economy is slowing, energy stocks continue to attract money. One of the brightest spots is that oil exploration as evidenced in the shares of the iShares U.S. Oil Exploration and Production ETF (IEO).
The ETF has entered an orderly consolidation pattern between the $94 and $98 price points. ADI and OBV are off their bottoms and may weaken in the short term. But for now, if the 50-day moving average holds, this looks like a pause that refreshes.
Do you own energy or tech stocks? What’s your plan of action with the homebuilders? Join the smart money at Joe Duarte in the Money Options.com. You can have a look at my latest recommendations FREE with a two-week trial subscription. You can also get the latest big picture news and analysis on real estate here.
Hopeful Signs Emerge; Fingers Crossed
The worst may be over in the short-term for stocks. The New York Stock Exchange Advance Decline line seems to have bottomed out after its RSI indicator hit the 30 area. Hopefully it will stick.
Nevertheless, NYAD remained below its 20-day and 50-day moving averages; thus, it could still roll over and perhaps still test the 200-day moving averages.
The Nasdaq 100 Index (NDX) is now negotiating a trading range between 14500 and 15250 with its 50-day moving average offering overhead resistance. Accumulation/Distribution (ADI) and On Balance Volume (OBV) may have bottomed out.
The S&P 500 (SPX) remained below 4500, but above 4350, where it found support twice last week. It is also below its 20-day and its 50-day moving averages. But both ADI and OBV may be bottoming out.
Again, VIX Remains Below 20
VIX has been a bright point in the market for the last couple of weeks as it’s failed to rally above the 20 area. This is good news as a move above 20 would be very negative as it would signal that the big money is finally throwing in the towel on the uptrend.
When the VIX rises, stocks tend to fall, as rising put volume is a sign that market makers are selling stock index futures to hedge their put sales to the public. A fall in VIX is bullish, as it means less put option buying, and it eventually leads to call buying, which causes market makers to hedge by buying stock index futures. This raises the odds of higher stock prices.
Liquidity Remains Stable
Liquidity is stable, but, again, may not remain so for long if the current fall in stock prices accelerates. The Secured Overnight Financing Rate (SOFR), which recently replaced the Eurodollar Index (XED), but is an approximate sign of the market’s liquidity just broke to a new high in response to the Fed’s move. A move below 5.0 would be more bullish. A move above 5.5% would signal that monetary conditions are tightening beyond the Fed’s intentions. That would be very bearish.
To get the latest information on options trading, check out Options Trading for Dummies, now in its 4th Edition—Get Your Copy Now! Now also available in Audible audiobook format!
#1 New Release on Options Trading!
Good news! I’ve made my NYAD-Complexity – Chaos chart (featured on my YD5 videos) and a few other favorites public. You can find them here.
Joe Duarte
In The Money Options
Joe Duarte is a former money manager, an active trader, and a widely recognized independent stock market analyst since 1987. He is author of eight investment books, including the best-selling Trading Options for Dummies, rated a TOP Options Book for 2018 by Benzinga.com and now in its third edition, plus The Everything Investing in Your 20s and 30s Book and six other trading books.
The Everything Investing in Your 20s and 30s Book is available at Amazon and Barnes and Noble. It has also been recommended as a Washington Post Color of Money Book of the Month.
To receive Joe’s exclusive stock, option and ETF recommendations, in your mailbox every week visit https://joeduarteinthemoneyoptions.com/secure/order_email.asp.