
Week Ahead: Markets May Step Into The New Year On A Quiet Note; Staying Above This Zone Crucial
As the session on Friday ended, we not only ended the trading week but also the month and the year. 2022 was choppy for the equities to say the least. The markets had to navigate the weak trends, geopolitical tensions, inflation, fear of recession, and a slew of rate hikes from the central banks across the world. In the week that went by, the markets continued to stay below the 18600 mark; however, they have been able to successfully defend the crucial supports on a closing basis. The trading range got narrower; NIFTY oscillated in a 491-point range over the past five days. Following a couple of volatile sessions, the headline index NIFTY ended with a net gain of 298.50 points (+1.68%) on a weekly basis.
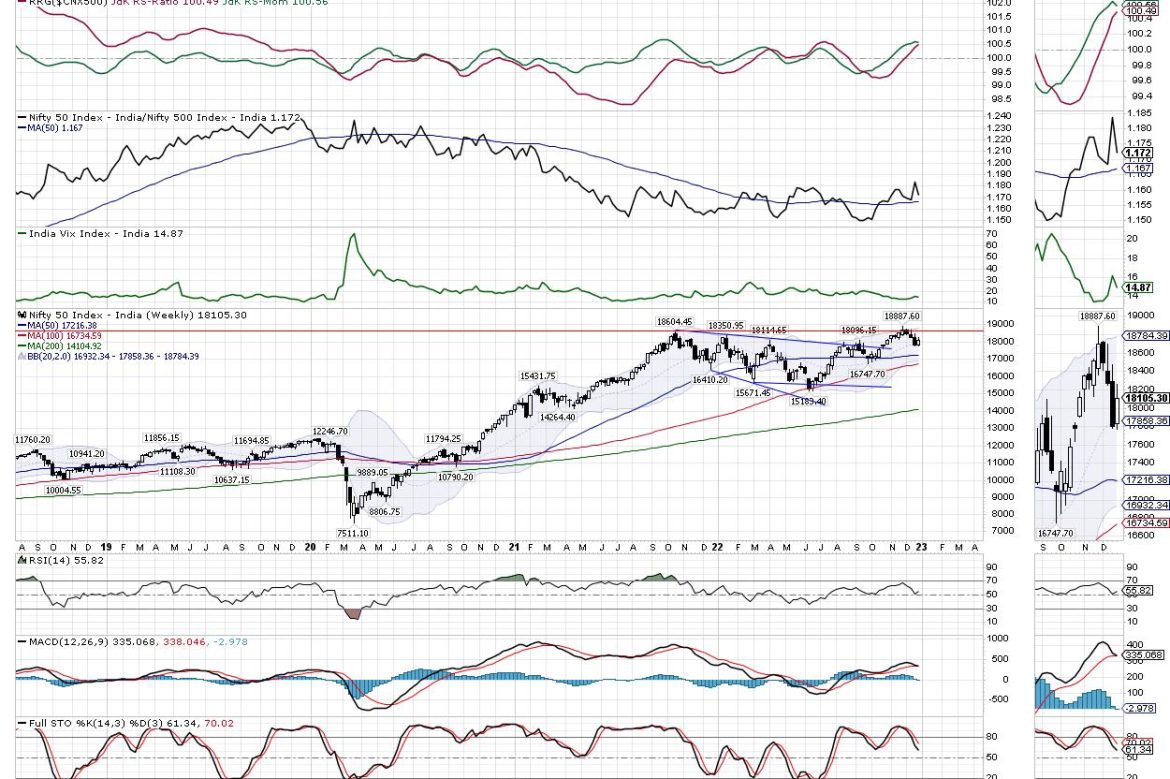
With this, on a YTD basis, NIFTY has ended the year with a gain of 4.33%. On a monthly note though the index ended up losing 3.48%. From a technical perspective, the index has defended the shorter 20-Week MA that stays at 17858. Corroborating this support with the levels on the daily chart, the zone of 17850-18000 is supposed to act as a strong support zone for the NIFTY. Only a slippage below this point will make the markets incrementally weaker. Volatility dropped; INDIAVIX came off by 8% to 14.87 levels again.
The markets are placed at a crucial juncture; keeping their head above 17850-18000 zones would be crucial to avoid weakness. The coming week is likely to see the levels of 18350 and 18500 acting as resistance points. The supports come in at 17900 and 17600 levels.
The weekly RSI is 55.81; it stays neutral and does not show any divergence against the price. The weekly MACD has shown a negative crossover on the expected lines; it is now bearish and trades below the signal line. No other important patterns were noticed on the candles.
The pattern analysis of the chart shows that so long as it stays above 18000 levels, there are possibilities of it staging and up move again. Only a violation of the 17850-18000 zone will invite weakness. The index had attempted a breakout by moving past the previous lifetime high point of 18604; however, after testing 18887 levels, the index not only retested the breakout point of 18600 but also significantly slipped below that level. As of now, the attempted breakout has failed and NIFTY continues to face strong resistance at 18600 levels.
The last trading week of had witnessed lower participation on account of the holiday season. The coming week may stay subdued as well. Looking at cross-asset analysis, there are possibilities of the Dollar Index showing some weakness; this may play out well for metals and commodities stocks. However, there is no confirmation of this weakness on the DXY charts. Besides this, the markets may largely stay stock-specific. It would be wise to continue keeping leveraged exposures under control and overall exposures at modest levels. A cautious approach is advised for the coming week.
Sector Analysis for the coming week
In our look at Relative Rotation Graphs®, we compared various sectors against CNX500 (NIFTY 500 Index), which represents over 95% of the free float market cap of all the stocks listed
The analysis of Relative Rotation Graphs (RRG) shows the PSE, Infrastructure, Metal, PSU Bank, Banknifty, and the Service Sector indices are placed inside the leading quadrant along with Commodities and Financial Services. Among these, the Services Sector Index and Banknifty are seen slightly faltering on the relative momentum front. However, all these groups are set to relatively outperform the broader markets.
The FMCG index was in the weakening quadrant but that too has rolled inside the lagging quadrant.
Nifty MidCap, Auto, Consumption, and FMCG groups are inside the lagging quadrant. Media and Pharma groups also continue to languish inside the lagging quadrant. NIFTY Realty Index is inside the lagging quadrant but it is seen improving on its relative momentum.
Nifty IT is inside the improving quadrant, but it is seen giving up on its relative momentum; this may result in the overall sector struggling to say resilient but stock-specific performance may not be ruled out.
Important Note: RRG™ charts show the relative strength and momentum for a group of stocks. In the above Chart, they show relative performance against NIFTY500 Index (Broader Markets) and should not be used directly as buy or sell signals.
Milan Vaishnav, CMT, MSTA
Consulting Technical Analyst