
Week Ahead: NIFTY May Stay Ranged; Trending Moves To Occur Only If These Edges Are Breached
The markets closed on a negative note for the third week in a row; over the past five sessions, the Nifty remained largely on a declining trajectory except for the last trading day where it saw some relief rally from the lower levels. Following a strong weekly decline of 1167 points two weeks ago, the Nifty has thereafter traded relatively in a lesser range but has by and large exhibited a weak bias. The trading range this time remained similar to that of the previous week; the Nifty oscillated in 644 points over the past five days. The volatility remained stagnant; the India Vix came off by 1.38% to 13.04 on a weekly basis. While continuing to find short-term pattern support, the headline index closed with a net weekly loss of 110.20 points (-0.44%).
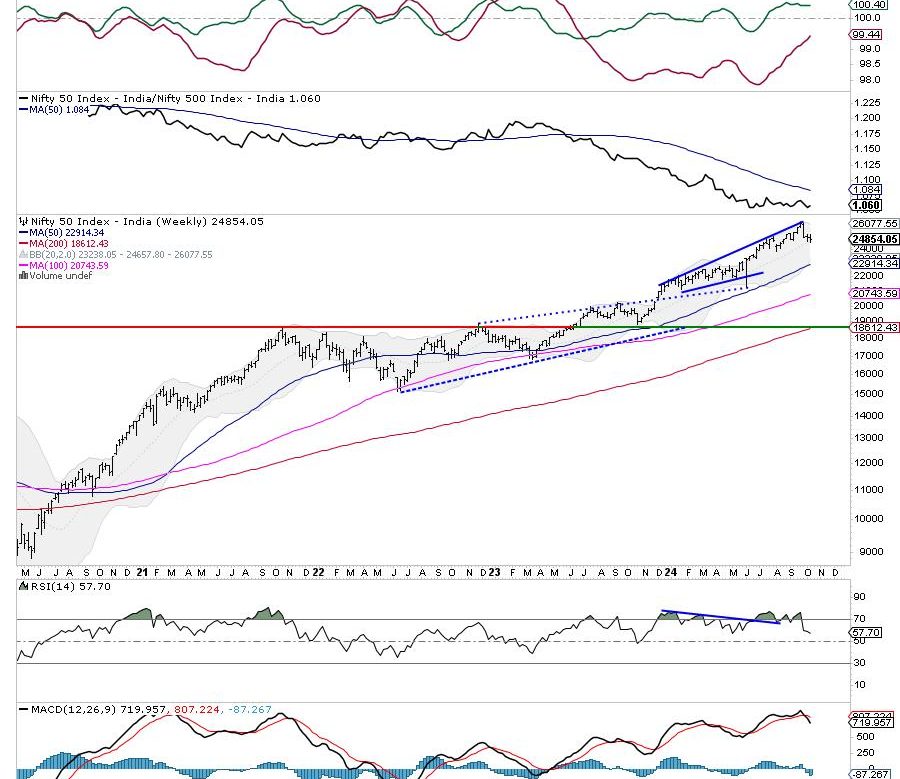
Many important levels have been tested over the past week; a few important levels need to be watched as well. The Nifty tested the 20-week MA which currently stands at 24657. The 100-Day MA is currently at 24507. This makes the 24500-24650 a very important support zone for the index. On the other hand, the derivatives data show a maximum accumulation of Call OI in the 25000-25100 range making these levels an immediate resistance area for the markets. This is likely to keep the markets in a capped range; if the technical rebound extends itself, it is likely to find resistance in the 25000-25100 zone. In the same breadth, markets would get weaker if the 24650-24500 zone is violated on the downside. So long as either of these ranges are not violated, expect the Nifty to oscillate back and forth in a defined range.
A quiet start is expected to the coming week; the levels of 25000 and 25130 are likely to act as resistance points for the markets. The supports come in at 24650 and 24450 levels.
The weekly RSI is 57.70; it stays neutral and does not show any divergence against the price. The weekly MACD is bearish and trades below the signal line.
A pattern analysis of the weekly chart shows that the Nifty is finding support at an extended trend line. This trendline starts from 22124 and subsequently joins higher tops while it extends itself. Besides this, this pattern support on the weekly chart also coincides with the 20-week MA and the 100-day MA making the zone of 24500-24650 an important short-term support zone for the Nifty. If this zone is violated, we might see some incremental weakness creeping into the markets.
The coming week is likely to stay ranged; no trend would emerge so long as the Nifty is between 24500—25000 levels. Only if the higher level is taken out or the lower one gets violated, we will see the trend emerging in the markets again. Until that happens, expect the markets to remain in a range. However, we should also note that as long as the zone of 25000-25100 is not removed, we will remain vulnerable to profit-taking bouts from higher levels. A major sectoral shift is seen in the markets that may cause leadership to change. Banks and financial services along with Energy, Consumption, etc., are likely to show improvement in their relative strength. It is recommended that one must continue to adopt a highly selective approach while keeping overall leveraged exposures at modest levels.
Sector Analysis for the coming week
In our look at Relative Rotation Graphs®, we compared various sectors against CNX500 (NIFTY 500 Index), which represents over 95% of the free float market cap of all the stocks listed.
Relative Rotation Graphs (RRG) show Nifty IT, Pharma, Consumption, FMCG, and Services Sector indices are inside the leading quadrant. Barring the Services Sector Index, the rest are showing a slowdown in their relative momentum against the broader markets. However, they may continue to show resilient performance in the coming week.
The MidCap 100 and Nifty Auto Index stay inside the weakening quadrant; they may continue giving up on their relative performance.
The Energy, Commodities, PSE, Realty, Nifty Bank, Infrastructure, Metal, and PSU Bank indices are inside the lagging quadrant. However, except for the Infrastructure and PSE index, all others are showing strong improvement in their relative momentum against the broader market.
The Nifty Financial Services Index has rolled inside the improving quadrant. This may lead to its phase of relative outperformance. The Media Index is also inside the leading quadrant; however, it is seen sharply giving up its relative momentum against the broader Nifty 500 index.
Important Note: RRG™ charts show the relative strength and momentum of a group of stocks. In the above Chart, they show relative performance against NIFTY500 Index (Broader Markets) and should not be used directly as buy or sell signals.
Milan Vaishnav, CMT, MSTA
Consulting Technical Analyst