
A Sector Rotation Summary
A quick assessment of current sector rotation on the weekly Relative Rotation Graph:
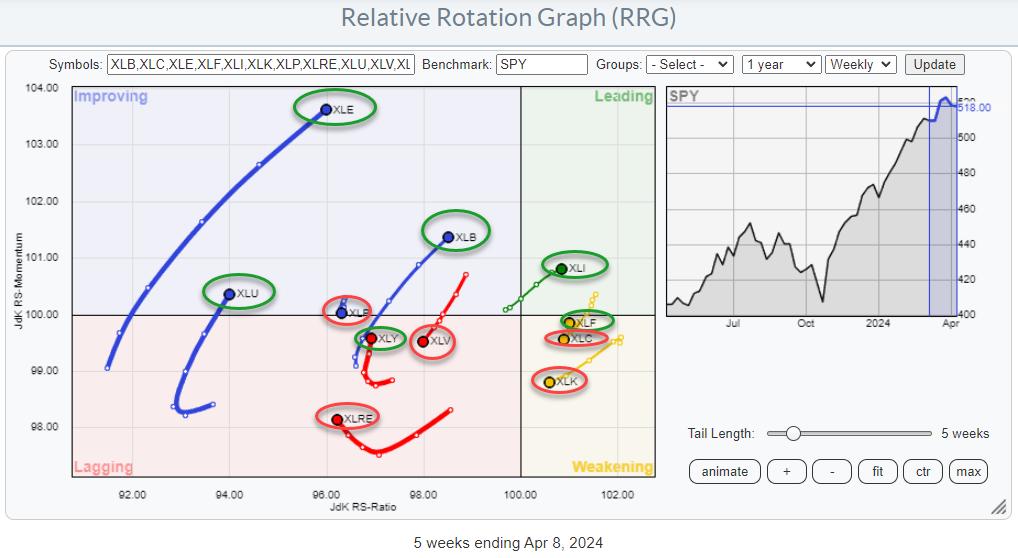
XLB: Still on a strong trajectory inside the improving quadrant and heading for leading. The upward break of overhead resistance on the price chart seems to be stalling at the moment, which could cause its relative strength compared to the S&P 500 to slow down. Overall, the trend, both in terms of price and relative, is still up.
XLC: Continues to lose relative strength and momentum inside the weakening quadrant and rotates toward lagging at a negative RRG-Heading. On the price chart, XLC is battling resistance, which causes its relative performance to slow down.
XLE: Is at the strongest rotation in this universe. Well inside the improving quadrant at the highest RS-Momentum reading and powered by the longest tail in the universe. The upward break in the price chart is holding up well, and the sector can even handle a small setback towards the former resistance area (just below ~95) without harming its uptrend.
XLF: Was on its way back to the leading quadrant after curling back up inside weakening, but this week’s dip is causing the tail to deviate from that path. This means we must watch this sector closely going into the close of this week and the beginning of next week to see if this is a temporary hiccup or a real change of direction. The nasty dip on the price chart pushes XLF back below its former resistance levels, which is usually not a strong sign. Caution!!
XLI: This is the only sector inside the leading quadrant at the moment, traveling at a strong RRG-Heading, taking the sector higher on both axes. The rally in the price chart is fully intact but seems to stall at current levels for three to four weeks. Plenty of room on the chart for a corrective move in this sector without damaging the uptrend.
XLK: The slow performance, primarily sideways, of the sector since the end of January has caused relative strength to flatten and for the sector to roll over and rotate into the weakening quadrant on the RRG. The jump today (Thursday, 4/11) caused an uptick in relative strength, but much more is needed to bring this sector back to the forefront.
XLP: Did not make it all the way up to horizontal resistance around 77.50 but set a lower high after a nasty reversal last week. The raw RS-Line continues steadily lower, causing the tail on the RRG to remain short and on the left-hand side of the graph, indicating a steady relative downtrend.
XLRE: After a rally at the end of last year, XLRE ended up in a sideways pattern that could turn out to be a double top after that rally. Such a top will be confirmed on a break below 37, which is the lowest low that was set in the week starting 2/12. When that happens, a decline all the way back to the late 2023 low becomes possible. The relative trend reversed back down after a very brief stint through the leading quadrant at the end of January.
XLU: Just moved into the improving quadrant from lagging but remains at a very low RS-Ratio level. The raw RS-Line continues to show a steady downtrend, making it hard for the tail to make it all the way to the leading quadrant. Price managed to break above a falling resistance line but shortly thereafter stalled in the area of Sept-23, Dec-23, and Jan-24 highs. Pressure remains in both price and relative terms.
XLV: After a short rotation through the improving quadrant that lasted roughly two months, XLV has now returned to the lagging quadrant and is pushing deeper into it on a negative RRG-Heading. On the price chart, XLV completed a (double) top formation and broke back below its former overhead resistance level, opening significant downside risk.
XLY: Is hesitating in a sideways pattern since mid-February, but still in a very shallow, uptrend. Relative strength continued to decline but is now nearing its late 2022 relative low, and the RRG-Lines are showing early signs of improvement.
Cap-weighted vs Equal-weighted
The RRG above shows the relative rotation of the relationships between the cap-weighted sector ETFs and their equal-weighted counterparts.
The more interesting information is coming from the tails that are far away from the benchmark. In this case, these are the Communication services sector, which is rolling over inside the leading quadrant, and Consumer Discretionary, which has just turned up inside the lagging quadrant.
This indicates that the large(er) cap communication services stocks are now starting to underperform the lower-tier market capitalizations. The opposite is true for Consumer Discretionary, where the opposite is happening, and larger market cap stocks are taking over from lower tier market caps.
A similar observation can be made for the Technology sector which is heading straight into the lagging quadrant, which suggests that large-cap tech is giving way to smaller names.
This information will be helpful when looking at RRGs for individual stocks inside the sectors.
#StayAlert: –Julius