
Sentiment And Small Caps Are A 1-2 Punch, Knocking Out The Staggering Bears
Listen, we all know what the NASDAQ, Magnificent 7, and technology have done and are doing. There’s no need to beat a dead horse. For those who somehow view the incredible rallies in these 3 to be bearish, so be it. How’s that perma-bear approach working out? I’ll skip right past this part of the market and discuss two other extremely bullish developments.
Sentiment
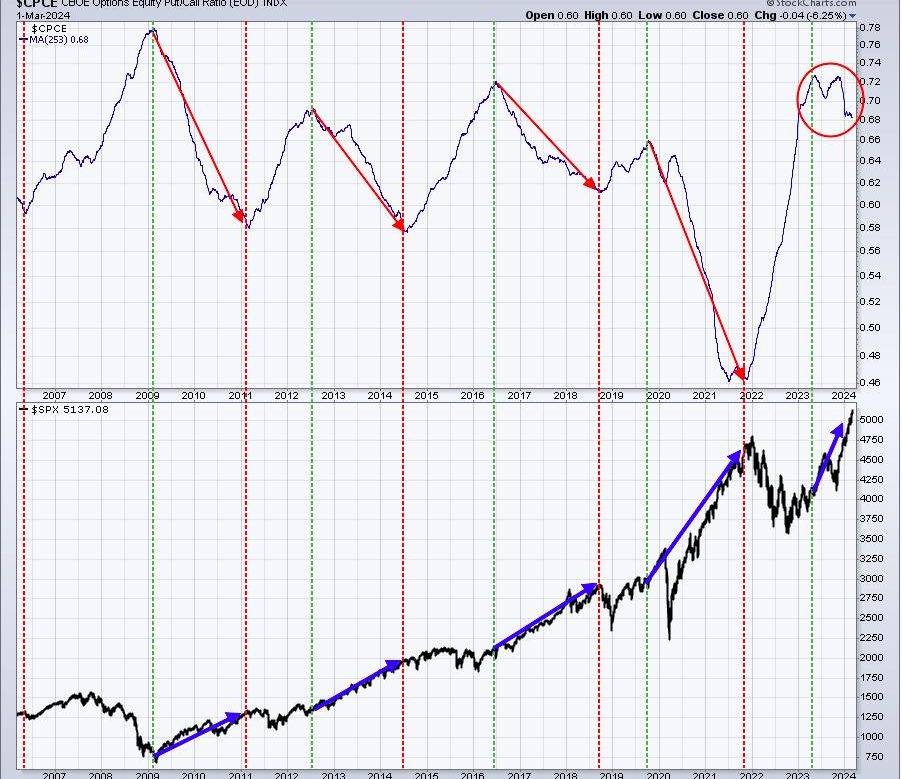
When the long-term 253-day SMA of the equity only put call ratio ($CPCE) takes a major turn, either higher or lower, it’s a signal that prevailing sentiment is reversing and that a reversing S&P 500 is likely to follow, or maybe has already started. That’s not my opinion, that’s historical fact. Take a look at this chart and tell me if you interpret something differently:
Human emotions go up and down and never is it more pronounced than with our money. As more and more money is lost, the worse we feel about stocks and the worse we believe it’s going to get. That results in a MASSIVE imbalance between call options and put options traded, with the latter seeing a higher and higher percentage traded until our emotions boil over. That normally coincides with an S&P 500 bottom. The flip side occurs as well. As the stock market trades higher and higher, there becomes another MAJOR imbalance in the number of call options and put options traded, with the former gaining the upper hand in a very significant way. What happens? The above 253-day SMA of the CPCE falls to low levels, coinciding with S&P 500 tops. We’re nowhere near a CPCE bottom….or an S&P 500 top – in my opinion, of course.
Those who believe the stock market is peaking and will fall precipitously from the current level, I’ve got some really, really bad news for you. We’ve just begun the process of unwinding the ridiculous level of fear associated with the 2022 cyclical bear market and the S&P 500 is heading much, much higher. Don’t take this literally. We’ll have pullbacks and occasional corrections along the way, but the path forward is HIGHER.
Small Caps
One asset class that has lagged badly over the past couple years has been the small caps. That group, however, has begun to show many more bullish signals. The IWM (ETF that tracks the small cap Russell 2000 Index) has already been trading much more bullishly on the longer-term weekly chart, breaking above a former triple top, falling back to test its rising 20-week EMA, then breaking out to a new high. This is how many charts get started in uptrends. Check out the IWM:
The green-shaded area highlights an 18-month period of pure consolidation. Any time you see price action consistently move above and below its 20-period moving average, there’s no direction, no trend. For me, I look for a 3-step process:
Break above price resistanceSuccessful test of 20-period EMA on pullbackBreak to another high
My 3-step process was completed last week. Look at the chart again and note the different behavior in the weekly PPO. This time, finally, the IWM is sustaining its upward price action as bullish momentum accelerates. Also, the weekly RSI has remained above 60 for an extended period of time, which rarely happens during consolidation periods.
In the short-term, I’ve been pointing out the bullish cup with handle pattern and the IWM has either broken out or the cusp of a breakout:
There are so many positives that I see the odds of a big move higher from here overwhelmingly stacked in the bulls’ favor. The accumulation is quite obvious. I’ve broken down how the IWM has traded during the trading day in the black rectangle on the price chart. Any weakness we’ve seen has generally occurred at the opening bell and before 11am ET. From 11-4pm ET, the IWM has moved considerably higher. This is what drives the AD line (accumulation/distribution line) higher and check out IWM’s AD line in the bottom panel above! When I called the bottom on the S&P 500 in mid-June 2022, this is the exact intraday behavior I saw on the SPY and QQQ and the AD lines there also began to soar. Now we’re getting Manipulation 2.0, only this time on the small caps. Prepare for an explosion higher!
The cup with handle pattern simply adds to all the other bullish signals and suggests an initial measurement near 225, another 10% higher than Friday’s close.
How do we prepare for this upcoming move higher? Well, we haven’t seen small caps this bullish since 2020. I believe some of the individual small cap names will see gargantuan moves to the upside over the next several months and I’m planning to feature 3 of them this week in my FREE EarningsBeats Digest newsletter. First up tomorrow will be a sub-$5 billion software company whose revenues easily beat consensus forecasts and EPS shattered estimates by 50%. There is a long-term double bottom in place and the stock is now trending rapidly higher. In my opinion, it’s just getting started as it still remains more than 50% below its all-time high in 2020, back when small caps were in favor.
For this stock on Monday and two other excellent small cap candidates on Wednesday and Friday mornings, simply CLICK HERE to subscribe to our EB Digest. It’s absolutely FREE, requires no credit card, and you may unsubscribe at any time!
Happy trading!
Tom