
If you ran a StockCharts Gap Ups scan on Thursday, chipmaker Advanced Micro Devices (AMD) would have come up on your list. The company might have missed Q4 2023 earnings expectations (though it beat on revenue), causing it to slump, but prices bounced quickly thereafter. Fundamentally speaking, its data center and client services, especially when factoring in AI, makes AMD a fundamentally solid buy.
The gap from its post-earnings low reveals that bulls see the retest of that low as a fundamental-based buying opportunity. But technically, is AMD a favorable buy? Let’s start with a longer-term view of AMD’s price action.
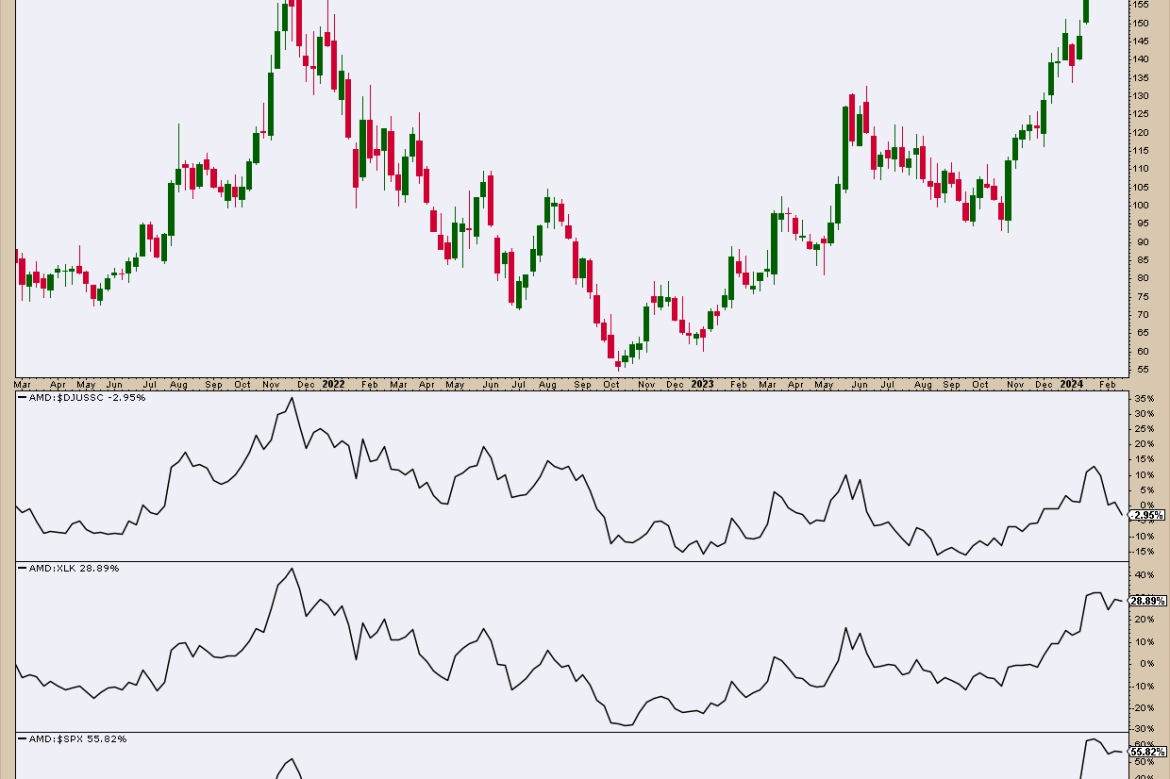
CHART 1. WEEKLY CHART OF AMD. The year-long current rally came to a halt with a two-month rectangle pattern.
The introduction of OpenAI’s ChatGPT created a turbulent environment for AMD, serving as a driving and pressuring factor to which the chipmaker’s future prospects hinged.
Perhaps this explains the company’s three-year underperformance in its own industry (semiconductors). That’s most likely due to Nvidia’s (NVDA) emergence as the top AI chipmaker following ChatGPT’s commercial debut. But, as you can see from the above weekly chart, AMD has outperformed the general tech sector (XLK) by almost 29% and the S&P 500 ($SPX) by over 55% in the same three-year period.
Reaching all-time highs in the last few months, AMD prices are bouncing within a narrow range, forming a two-month rectangle top; the last week ending with a spinning top indicating market indecision. And that state of indecision leads the stock to where it is today.
CHART 2. DAILY CHART OF AMD. There are two possible ways to trade this, depending on whether you’re looking to exploit a short-term or longer-term opportunity.
The gap that came up during the Gap Ups scan turned out to be a common gap. In short, it’s likely to get filled and is generally inconsequential (unlike a breakaway, runaway, or exhaustion gap).
Swing Trading AMD’s Rectangle Breakout
Instead, what you want to focus on is the rectangle top. Rectangle chart patterns can be bullish or bearish depending on market sentiment and the direction of the breakout. According to Thomas Bulkowski’s statistics…
Its average rise/decline stands at 51%/13%Pulling back to the breakout level (within 30 days) is 66% from the upside and 64% from the downside.Its percentage of meeting price targets is 78% on the upside and 54% on the downside.
And how are price targets measured? You’d calculate the height of the pattern (subtract the top price from the bottom price), add that figure to the top price (for an upside target) and subtract the figure from the bottom of the rectangle (for a downside target).
The top of the AMD rectangle pattern is approximately $184.90 and the bottom is approximately $162. This gives you a height of $22.90. Following the target calculation above, you get the following targets:
Note, these targets represent 100% of the measured move. Some traders might take profits at around 60% (it’s really up to the trader).
$207.80 – upside target$139.10 – downside target
The stop loss levels are relatively deep, as some traders might place stop losses on the opposite end of the rectangle breakout.
But what if you’re bullish and trying to enter a longer-term position?
Buying the Dip for a Long-Term Hold
Notice the 50-day Simple Moving Average (SMA), Kumo (Ichimoku Cloud), Money Flow Index (MFI), and the MACD.
The MFI, like a volume-weighted RSI, shows a bearish divergence and significant decline in buying pressure, giving an indication that a pullback is likely (but how deep, and whether it breaks below the rectangle, remains to be seen).The 50-day SMA and Kumo give a range of support to which you might anticipate a bullish reversal (wait for a bounce plus any indication, be it candle or volume, of strong bullish momentum).And finally, you might look for the MACD to cross the signal line to support any price event that potentially signals an upward turn.
The Bottom Line
The initial Gap Ups scan might have alerted you to a potentially bullish situation with AMD, whose fundamentals also seem favorable. But looking at the big picture on a weekly scale, you can see a wide area of congestion (which can indicate some level of market indecision) ending with a spinning top (indicating, more clearly, indecision). Rectangles can break either way. And this sense of indecision also reflects the technical vs. fundamental picture. So, as Jim Cramer would famously ask, is this an “investment” or a “trade”? Whatever you decide, the strategies for both are outlined above.