
Decoding 10-Year Treasury Yields: A Monthly/Secular Perspective Overview
I begin each year by reviewing the long-term technical positions and behaviors of the “Big Four” — 10-year yields, S&P 500 ($SPX), Commodities, and the US Dollar. I believe that interest rates, particularly in a credit-dependent/leveraged system, generally drive economic and market cycles. And, since by profession I am a rates/credit portfolio manager, strategist, and trader, I always begin there.
Granted, a macro view doesn’t often inform short-term trading, but anything that helps me understand the ebb and flow and interconnectedness of markets is helpful. More importantly, recognizing markets aligned for significant macro change can be invaluable, particularly in terms of risk management.
Since most good technical analysis is fractal, the same techniques used to describe the macro ebb and flow can often translate to shorter time frames. For the first two decades of my trading career, I kept a manual grid of the Big 4 plus a few other markets (gold, oil, 2-year Treasury, and so forth) that I updated hourly with price and the change from the prior hour. Doing so taught me a great deal about market interactions and interrelationships.
Monthly 10-Year Note Yield
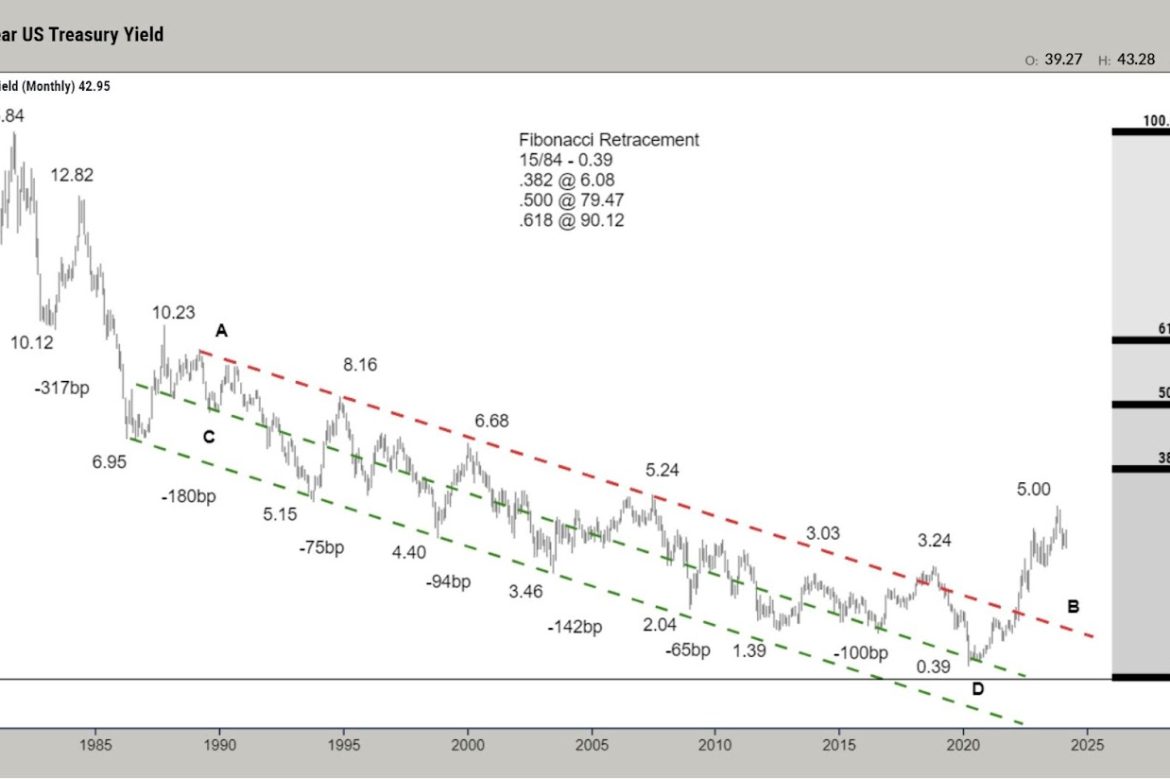
CHART 1. MONTHLY CHART OF 10-YEAR TREASURY YIELDS Over the last four decades, bond yields had consistently and reliably made lower highs and lower lows. The entire bull market was defined by a broad declining channel (A–B, C–D). The A–B downtrend line represented the “stride of demand,” or the zone where buyers consistently emerged, and the C–D line represented the “overbought line,” or the zone where supply or sellers consistently emerged.
Take Note. Falling bond yields are synonymous with higher bond prices. In other words, a downtrend in yield = a bull market in bonds.
From 2012 forward, there were growing signs that the long downtrend was aging. Four things stood out.
The repeated failure to push to the oversold line (C–D). The flattening out of the decline, where each push to a new yield low only covered around 100 bps. The 2018 spike to 3.24% that weakened the primary A-B downtrend.The bond push to the area around the center of the channel, and failure to push beyond the midline, much less into the overbought line (C–D), in March 2020. This change of behavior strongly suggested that demand was tiring. Multiple visible changes in behavior strongly suggested that the 40-year downtrend was in danger of terminating.
The clear break and acceleration above the A–B downtrend have moved the long trend from bullish to neutral. While it’s likely that the move above the November 2018 pivot at 3.24%, coupled with the prior behavior changes, mark the beginning of a long-term bear market, a higher low (perhaps forming in 2024) is needed to complete/confirm that change.
Note the additional changes in behavior. The 459 bps move from 0.39% to 4.98% represents the single largest bearish move since the inception of the bull market in September 1981, and the MACD oscillator level far exceeded the levels that marked yield highs throughout the entire bull market.
10-Year Yield Monthly With MACD
After producing the most overbought reading since the 1980s, the oscillator is trying to roll over and is displaying a small negative divergence (suggesting lower yields and higher price). While not a definitive roll, it suggests that there is some potential for a meaningful turn.
CHART 2. MONTHLY CHART OF 10-YEAR NOTE YIELD.
10-Year Yield Weekly
With this next chart, I will work with the weekly perspective, five and ten-year charts, and yield curves.
CHART 3. WEEKLY CHART OF 10-YEAR YIELD.
The following are several key fundamental points around rates:
The defining macro characteristic of the 40-year bull market has been the continual fall in the inflation rate. If that is changing (I believe it has), the secular bond trend is likely also to change.If the trend in inflation changes, the negative correlation between bonds and equity that drives 60/40 allocation and risk parity investing is likely to flip and become positive. In other words, bonds and equity would, outside of periods of panic or economic distress, rise and fall together, destroying the diversification benefit. This has been the historical norm, and I expect the market to move in that direction gradually.The caveat: Quantitative easing removed the value proposition from bonds; when equities began to decline in 2022, bonds couldn’t provide a safe haven. They were already far too expensive, particularly in the context of a Federal Reserve aggressively tightening monetary policy. That is no longer the case. Bonds, while still expensive, can again provide a tactical hedge should risk assets or the economy weaken dramatically.At first glance, this seems at odds with the change in correlation discussed above, but it is a difference between the secular tide versus the intermediate wave.Most substantive bond rallies result from a crisis that creates a flight-to-quality. In an overly financialized and levered economy, rising rates often break the weakest link in the economic chain, creating a new crisis and a subsequent flight-to-quality rally. While there is little evidence of a systemic crisis, the lagged effect of the rapid increase in rates in an overly financialized system must be top of mind.
The Bottom Line
While there is still more work to be done to confirm the trend change, I believe the bond trend is finally changing, as the world moves from the deflationary backdrop of the last several decades to an inflationary backdrop. I will be a much better seller of rallies and bearish technical setups in the weekly/intermediate perspective.
Disclaimer: Shared content and posted charts are intended to be used for informational and educational purposes only. The CMT Association does not offer, and this information shall not be understood or construed as, financial advice or investment recommendations. The information provided is not a substitute for advice from an investment professional. The CMT Association does not accept liability for any financial loss or damage our audience may incur.