
There’s no denying the strength we’ve seen in risk assets since the October market low. When my Market Trend Model turned bullish on all three time frames in mid-November, it was difficult to deny the overwhelming positive momentum for equities. This strong upward momentum has now brought the major indexes up to key resistance levels. Will there be enough gas left in the tank to propel the SPX above 4600 and force a retest of the all-time high around 4800?
There are three ways to think about this particular scenario. First, we can consider the technical configuration of the S&P 500 itself. What can the chart of the SPX tell us about the likelihood of further upside? Second, we can dig into market breadth conditions. Are we seeing signs of extreme breadth readings that tend appear similar to previous market tops? Finally, we can review leading names in the growth space. Are the Magnificent 7 stocks still fulfilling their leadership role? What about top names in other sectors?
Mindful investors take time to reflect on their experiences. What worked and what didn’t? What made your successful trades so successful, and what did you learn from the trades that didn’t go so well?
In our next FREE webcast, I’ll share my Top Ten Questions Every Investor Should Ask at Year End. I go through these same ten questions at the end of every year, helping me focus on celebrating wins, learning from losses, and improving routines. Join me on Tuesday, December 12th at 1:00 PM ET, where I’ll reveal the ten questions, share my responses, and empower you to create your own year-end review!
Sign up HERE for this free event and set yourself up for success in 2024 and beyond!
At the end of the day, we are in a period of transition. The days of Fed rate hikes appear to be behind us, and 2024 will almost certainly bring a rotation to lower rates and a more dovish Fed. The seasonal playbook (have you picked up your 2024 Stock Trader’s Almanac yet?!?) has correctly indicated strength in November and December. What can price analysis tell us about the trends into early 2024?
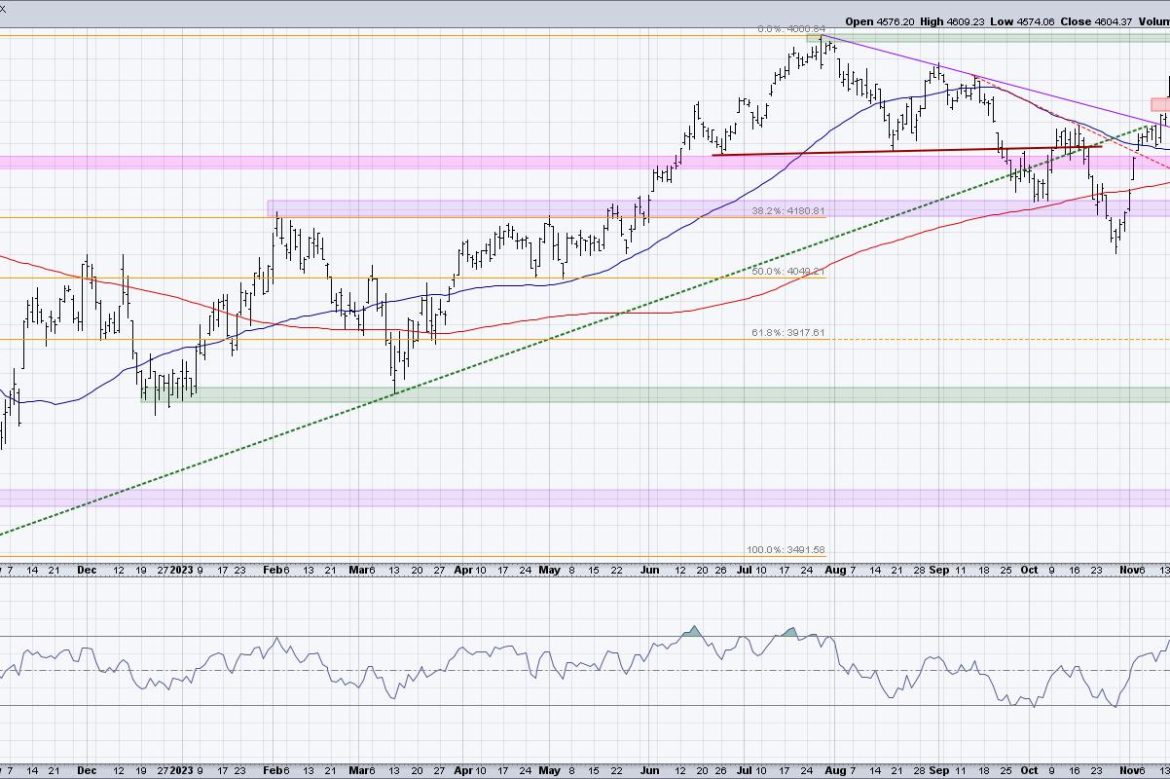
The S&P 500 Has Stalled Out at 4600
In a bullish market phase, charts don’t just trade to resistance but through resistance. As the S&P 500, Nasdaq 100, and so many other key charts have approached a retest of their summer highs, I’ve been skeptical of further upside, given the likelihood of at least a minor pullback from such a significant level.
It’s striking to me that the S&P 500 has basically recouped three months of losses in about five weeks. Not a bad move off the October low! The RSI also confirms the strength of the recent upswing, going from oversold in late October to overbought in early December.
There are two things I’ll point out about the RSI pushing so high quickly. First, it’s usually a negative sign in the short-term. To be clear, the market can often go much higher after the initial overbought reading, but when the RSI moves back below the 70 level, that can often indicate that a pullback is now in play.
Second, it’s usually a positive sign for the medium-term trend. Charts can indeed become overbought during bearish market phases, but it’s way more common to see this phenomenon during a broader rally. So the simple fact that the market is overbought is usually an encouraging sign.
Market Breadth Suggests a Pullback is Imminent
Out of all the S&P 500 members, 83% are currently above their 50-day moving average. A quick review of this indicator in 2023 will show how this has correctly identified a market in the fourth quarter of an uptrend, as opposed to the first quarter.
The pink shaded area in the bottom panel highlights when the indicator has moved above 85%, a level we just barely reached earlier this month. The previous three times it was above 85% — July 2023, November 2022, and August 2022 — all coincided with meaningful market tops.
Now, just because this indicator reaches 85% doesn’t mean it’s the end of the world. In fact, a breadth indicator like this often serves as more of an early warning of an impending top, as opposed to confirming a top has already occurred. So there certainly be a bit of further upside for the SPX. In fact, the panel above shows the percent of stocks above their 200-day moving average, which is well above 50%. This suggests a long-term bullish trend is still in play, as long as the indicator remains above that 50% level.
The Bullish Percent Index for the S&P 500 is also in the extreme bullish region, following the Nasdaq 100’s Bullish Percent Index above the crucial 70% level this week. Check out the red-shaded areas on this chart, and you’ll see that, when the indicator pushes above 70% and then back below, it’s usually a decent time to get defensive in your positioning.
Almost Every Stock on the Planet is Overbought
This overextended market is not just defined as such because the indexes have reached key resistance levels, or because market breadth conditions signal overbought conditions, but because the individual stocks that make up our major indexes are also showing all the signs of exhaustion.
Let’s review some large-cap names, not just in growth sectors like Technology, but more value-oriented sectors as well.
Home Depot (HD) has round-tripped back to its 2023 high around $330, and the RSI is overbought for the first time since the July peak.
The Financial sector has rejoined the bullish party, with regional banks like Keycorp (KEY) logging solid returns in November. KEY recently broke to a new swing high around $12.50, and the RSI pushed above 70 right as the breakout occurred.
The Industrial sector also has its share of strong recent performers, including airlines and other travel names pushing higher as interest rates and crude oil prices move lower. But MMM and other mega-cap stocks in this sector are experiencing overbought conditions as they push above moving average support.
So are overbought conditions a good thing or a bad thing? Well, both, depending on your time frame. As we mentioned above, the market has followed the seasonal trends almost perfectly in 2023, and November and December are two of the strongest months of the year. So the long-term story remains positive here, in my opinion.
The Santa Claus rally period is often incorrectly declared any time there’s an upward move in December. But the Santa Claus rally actually only runs from late December to early January, and is more about the week between Christmas and New Year’s Day. So there’s plenty of space in the seasonal expectations for a brief pullback in mid-December to set us up for a bullish move in early 2024.
At the end of the day, the most bullish thing the market can do is go up. And I still see that in the cards, but only after the recent overbought conditions are alleviated!
RR#6,
Dave
P.S. Ready to upgrade your investment process? Check out my free behavioral investing course!
David Keller, CMT
Chief Market Strategist
StockCharts.com
Disclaimer: This blog is for educational purposes only and should not be construed as financial advice. The ideas and strategies should never be used without first assessing your own personal and financial situation, or without consulting a financial professional.
The author does not have a position in mentioned securities at the time of publication. Any opinions expressed herein are solely those of the author and do not in any way represent the views or opinions of any other person or entity.