
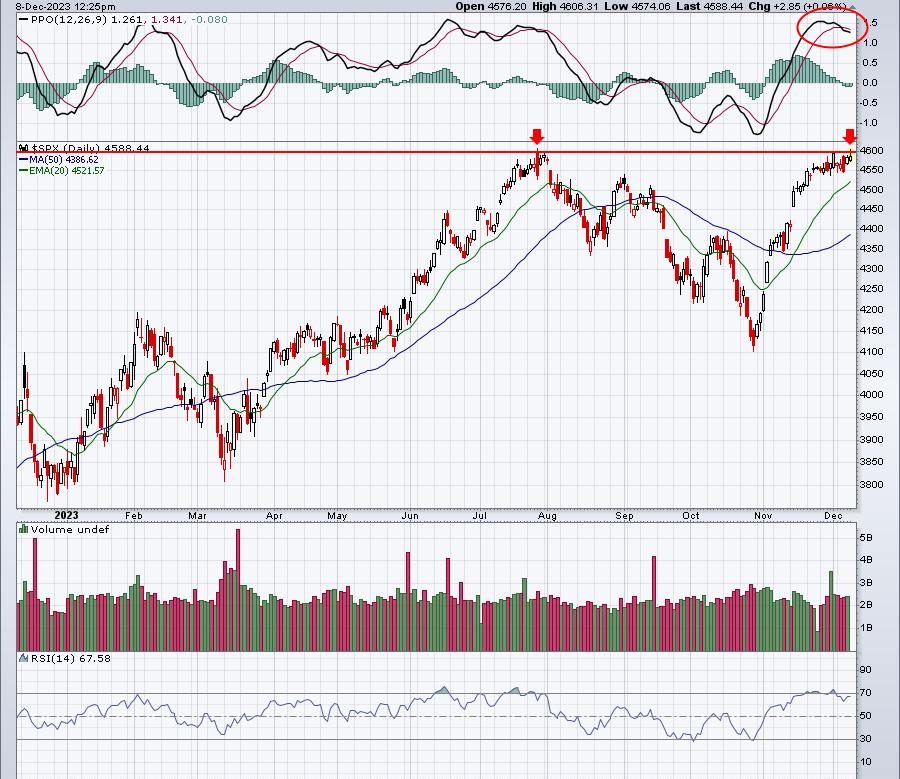
I think just about everyone is on “4600 watch” on the S&P 500 and I can’t blame them. It’s a big level. That was our high in July and now the subsequent recovery has returned the S&P 500 to the most critical price resistance of 2023:
At the time of this writing, the S&P 500 is a dozen points away from this key level, with an earlier high above 4600. A false breakout on the close today, accompanied by that daily PPO rolling over isn’t a great look and combination, knowing how important this breakout would. But even a breakout doesn’t exactly suggest it’s an all-clear-ahead signal. That PPO is suggesting momentum is seriously slowing right now. If we do see a breakout, then be on the lookout for a reversing candle at some point next week. That very well could precede a bout of selling, perhaps as much as 3-5%.
In addition to a few technical reasons to be cautious, next week isn’t a great one for the S&P 500 historically either. Should we struggle the next 1-2 weeks, there is a silver lining. The December 22 through December 31 period is extremely bullish as you can see from the daily annualized returns on the S&P 500 (since 1950) below:
December 21: +71.54%December 22: +31.82%December 23: +16.67%December 24: +27.39%December 25: Market Closed – Christmas holidayDecember 26: +126.94%December 27: +40.72%December 28: -10.07%December 29: +45.11%December 30: +29.78%December 31: +38.5%
For the entire Dec 21-31 period, the annualized return of +40.21% is more than 4x the average S&P 500 return of roughly 9% since 1950. S&P 500 prices rarely see a cumulative loss during these final 11 days of the year.
I believe it’s critical to fully understand the key historical trends on the S&P 500. At EarningsBeats.com, we continue to offer a FREE 7-page PDF report on critical S&P 500 historical trends that every investor/trader should be aware of. To download your FREE copy, CLICK HERE!
Happy trading!
Tom