
Well, we’re into the final month of 2023. Are we having fun yet? I’d argue that the bulls are having a blast, with many stocks surging year-to-date. I love all the attention that the “Magnificent 7” are attracting. Stock market skeptics are ALWAYS looking for the next big thing to take the stock market to its knees, yet rarely do any of them work. But now the buzz words are “Magnificent 7”. Stocks can’t go higher, because the overall market strength is too narrow. Whatever. What do we want to see – the largest, most influential and innovative companies in the world, that employee MILLIONS of people worldwide, to perform poorly? Would that make everyone feel better? 🙂
Bull markets are led by leaders and money pouring into aggressive sectors on a relative basis is BULLISH. I absolutely want the Magnificent 7 to lead. These stocks are all in the most aggressive areas of the market. When they’re being bought and are outperforming the rest of the market, it’s a “risk on” market environment, which is the engine of a secular bull market advance.
When stocks are moving lower, the overwhelming majority of market participants are afraid to buy, thinking prices have to fall further. When stocks are moving higher, the overwhelming majority of market participants say “Don’t Chase!” All of my “beneath the surface signals” suggest this rally has legs and is quite sustainable. Would it be better to enter at lower prices on a market pullback? Sure, who doesn’t want to buy cheaper. But I’d also argue that secular bull market advances wait for NO ONE. You’re either on the train or you’re not. At EarningsBeats.com, we’ve been on the train since June 2022. Until you learn to ignore the naysayers, many of whom never go away, you’ll find investing to be extremely frustrating and you’ll be set up for failure.
Instead of trying to call a top at every possible chance, why not evaluate the strength of the advance?
Over the past 5 weeks, we’ve seen a massive advance that’s completely recovered all the losses during the recent 3-month market correction from July through October. Rapid, heart-thumping gains are a hallmark of secular bull market advances, by the way. Leaders during such advances can tell us a lot. So what’s been leading? Let’s start with sectors. Since the October bottom, here is the performance order of all 11 sectors:
Real estate (XLRE): +17.50%Technology (XLK): +15.18% Financials (XLF): +15.01%Consumer discretionary (XLY): +14.37%Industrials (XLI): +12.75%S&P 500 ($SPX): +11.59%Materials (XLB): +11.21%Communication services (XLC): +10.81%Utilities (XLU): 8.17%Health care (XLV): +7.06%Consumer staples (XLP): 6.56%Energy (XLE): +0.46%
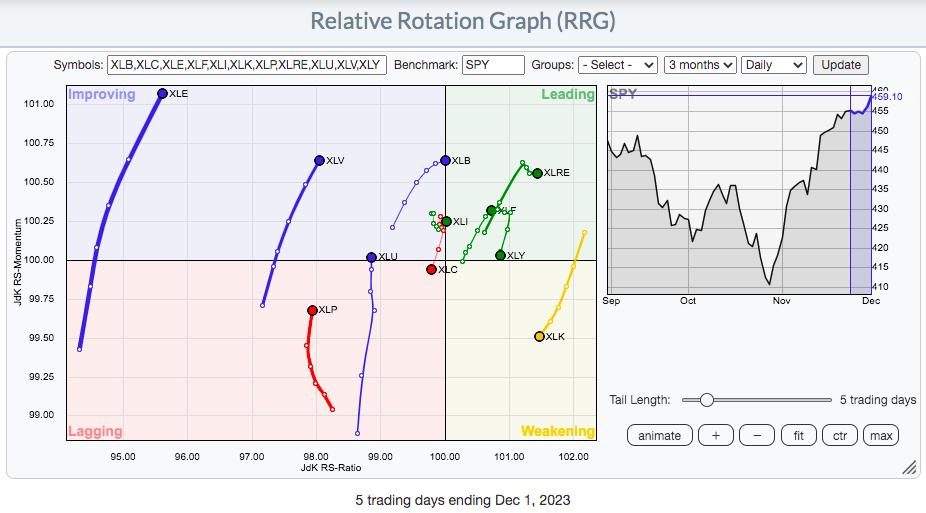
Look at that rotation! Does it appear that the big Wall Street firms are ditching the aggressive sectors and turning more defensive? Honestly, the exact OPPOSITE happened. Most defensive sectors are found at the bottom, that’s where the relative selling has taken place. Of the 5 sectors that beat the benchmark, rotation benefited 4 of our 5 aggressive sectors. Sorry, that’s not likely taking place just before another big leg down. It makes no common sense.
Here’s an RRG chart to show this rotation more visually:
If you’re concerned about the XLK moving into the “Weakening” quadrant, understand that leading sectors many times move into the weakening quadrant, before returning to the leading quadrant. Here’s the same RRG, but this time with the tail length at the maximum 30 days (coincides with the recent surge from the October low), so that you can see how the XLK has traveled:
A month ago, the XLK also moved from leading to weakening quadrants and then it returned to leading, stronger than ever. Staying on the right side of this chart tells us that the XLK has remained a relative strength leader throughout. Technology isn’t typically a great performer during December, so I suspect we might even see further weakness, perhaps touching into the lagging quadrant before moving straight back to leading in January, when the seasonal forecast turns much brighter.
Speaking of seasonality, you can still get your FREE copy of my S&P 500 seasonal PDF by CLICKING HERE and signing up with your name and email address. It’s 7 pages, highlighting the most critical seasonal patterns that every trader/investor should be aware of on our benchmark index. If you aren’t learning, you’re losing ground to every other trader who is. The 2nd PDF in this 2-part series is 70 (!!!) pages long and provides more seasonal details of the S&P 500, along with historical tendencies of 16 key individual stocks, including the Magnificent 7, and several others. I used Part 2 information to execute one of my best trades of the year – on NVDA based on its bullish November seasonal pattern. Check out NVDA’s run in November:
The reversing candle at price support set this trade up technically, but it was the knowledge of NVDA’s seasonal pre-earnings run that gave me the confidence to make my largest investment of 2023. It paid off handsomely thanks to the Bowley Trend 2-part PDF series corroborating the technical outlook.
Here’s a bonus for signing up for this 2-part series. The 2nd part comes with a nominal fee of $27, but will include an event on Monday, December 4th at 4:30pm ET to provide further details and clarity. I’ll discuss in detail the best timing for trades for each of the 16 individual stocks. Let’s nail several more NVDA-type trades! This event will be open to all EB members, including those who purchase the Bowley Trend series, part 2. Hope to see you there!
Happy trading!
Tom