
What Are The Chances Of A Market Crash? This Indicator Says ZERO!
We can use sentiment indicators for a lot of purposes. I routinely follow the 5-day SMA of the equity only put call ratio ($CPCE) to help spot short- to intermediate-term bottoms. It’s not quite so effective at calling market tops, but it does work in that regard many times as well. When I go out on a limb to call major market bottoms, my CPCE work is usually one piece of my analysis in putting together that jigsaw puzzle. I also have studied the Volatility Index ($VIX) a great deal. The VIX is the annualized “implied volatility” of the S&P 500 that helps investors estimate how much the S&P 500 will fluctuate over the next 30 days. The calculation is based on near-term S&P 500 options traded on the CBOE. If market makers are expecting high volatility ahead (normally during market downturns), premiums on these options will be higher and more costly for traders. When market makers are expecting low volatility ahead (normally during bullish market periods), premiums on these options will be lower and less costly. When we see big stock market declines, option premiums skyrocket and the VIX accelerates higher. Historically, the stock market doesn’t perform well with the VIX above 20, which is why I watch that level so closely.
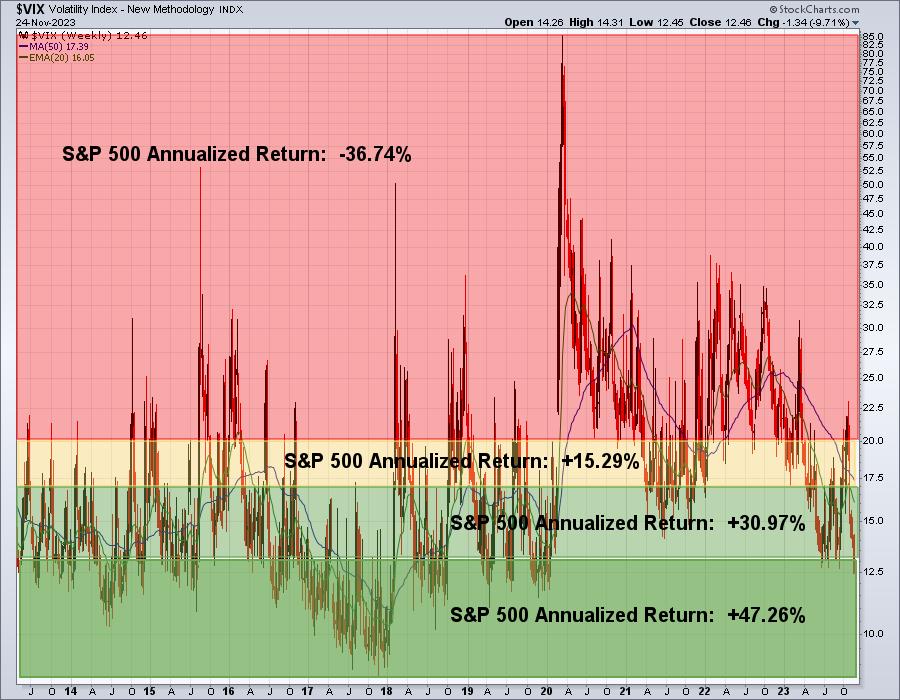
Let me illustrate how the S&P 500 has performed when the VIX is at various levels:
This chart goes back to 2013, when the S&P 500 cleared its double top from 2000 and 2007, effectively ending the secular bear market from 2000 through 2013. It’s a chart of the VIX, but I’ve broken it down by value. The red-shaded area highlights S&P 500 annualized returns when the VIX closes above 20. The yellow-shaded area highlights S&P 500 performance when the VIX is in the 17-20 range. The light-green shaded area highlights performance when the VIX closes in the 13-17 range and the dark-green shaded are highlights performance when the VIX closes below 13. You can see that the lower the VIX goes, the better the S&P 500 performs. This performance chart also suggests that we be extremely careful whenever the VIX is above 20. I’d argue it makes sense to be in cash to eliminate stock market risk at that point – or at least take steps to reduce risk.
One thing we can conclude from looking at the above chart. The VIX closed on Friday at 12.46, falling into that dark-green shaded area. Typically good things happen when the VIX is this low. I know there are plenty of people that believe a market crash is right around the corner. Sorry, but the VIX in the 12s indicates that we shouldn’t be considering that AT ALL right now.
I’ll give you a couple more stats from the research I did. First, you need to know that during the current secular bull market advance, there have been 2677 trading days and the S&P 500 has closed higher 54.2% of those days. I’ve broken down the chance of the S&P 500 closing higher when the VIX is in each of those shaded areas on the chart. Check this out:
% of days S&P 500 closes higher when VIX closes above 20: 44.81%% of days S&P 500 closes higher when VIX closes between 17-20: 51.04%% of days S&P 500 closes higher when VIX closes between 13-17: 55.34%% of days S&P 500 closes higher when VIX closes under 13: 66.28%
The lower the VIX goes, the more bullish the stock market gets. Embrace this low VIX, don’t fear it.
If you enjoy the way we look at the stock market at EarningsBeats.com, then I’d encourage you to sign up for our service using our Fall Special. It’s our absolute best deal of the year and our market guidance, research, and education is unparalleled. CLICK HERE for more information. It’ll only last a week longer!
If you have any questions, feel free to reach out to us at “support@earningsbeats.com”
Happy trading!
Tom