
SPX Monitoring Purposes: Long SPX 10/27/23 at 4117.37.
Gain since 12/20/22: Over 26%.
Monitoring Purposes GOLD: Long GDX on 10/9/20 at 40.78.
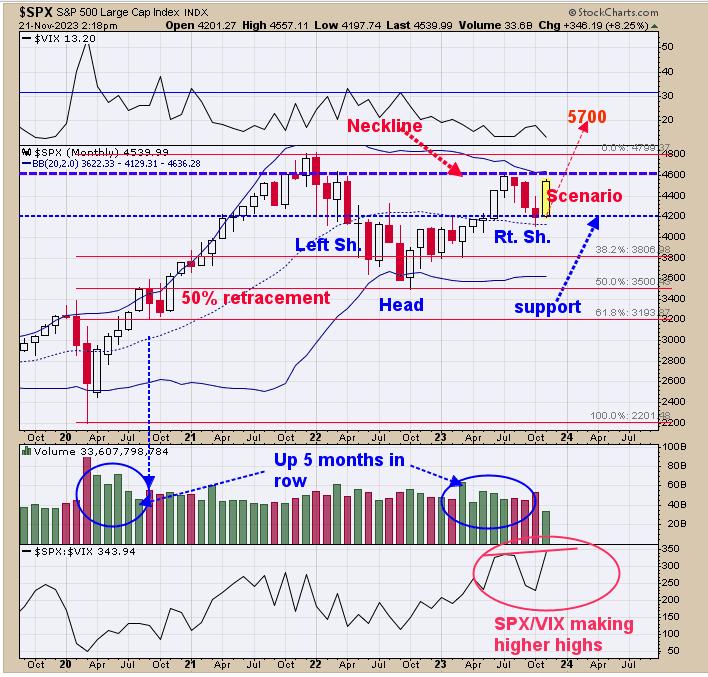
Above is the monthly SPX chart. The pattern that appears to be forming is a head-and-shoulders bottom and the right shoulder is forming now. The neckline lies near the 4600 range and would need a “Sign of Strength” through that level to confirm this pattern. The bottom window is the monthly SPX/VIX ratio, which has made a higher high, while the SPX so far has made a lower high. The SPX/VIX ratio leads the SPX, suggesting that, at some point, the SPX will break to a higher high. We are long SPX 10/27/23 at 4117.37.
We updated this chart from yesterday. The bottom window is the SPY, and next higher window is the TLT/VVIX ratio. It is common near short-term highs for the SPY to make higher highs and the TLT/VVIX ratio to make lower highs (noted in shaded pink). What we are seeing now is that the SPY is continuing to make higher highs and the TLT/VVIX ratio is also making higher highs, suggesting the current rally may continue (noted in shaded light blue). The SPY was up 5 days in a row going into Monday; going up 5 days in a row foretells the market will be higher within five days 83% of the time.
Last Thursday’s report said, “above is the Bullish percent index for the Gold Miners index. The bullish percent index measures the percent on stocks that are on point and figure buy signals. For a valid bullish signal, the Bullish Percent index would need to rise. Since the beginning of October, the bullish percent index has been rising from 10% to the current reading of 25%, which in turn shows this market is getting stronger as more stocks trigger buy signals. GDX has not traded above its previous high of the 30.00 range yet, whereas the bullish percent index has made higher highs, suggesting GDX’s next test of 30.00 will be exceeded.” The bullish percent index now stands at 32.14% and GDX still hasn’t broken 30.00.