
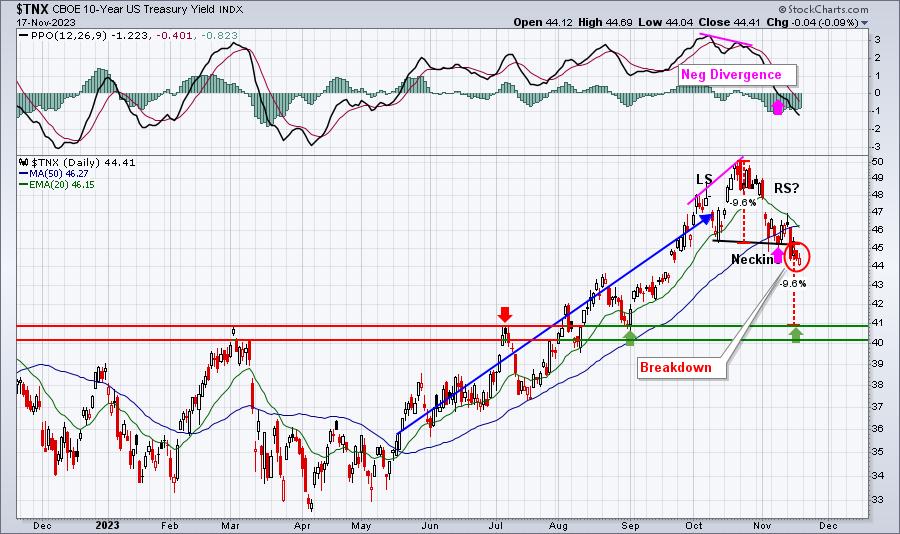
The 10-year treasury yield ($TNX), and its recent decline, is certainly aiding, at least in part, the recent surge in U.S. equities. After hitting 5.0% on October 23rd, the TNX has been in a steady decline. As I see it, we’ve got further downside in the yield based on the confirmation of a head & shoulders top:
The setup was there. The confirmation occurred on the breakdown below neckline support. The ultimate measurement beneath the neckline is equal to the distance from the top of the head (5.00%) to the neckline at roughly 4.55%. That would take us to 4.10% or thereabouts. I see a couple yield support levels at 4.00% and 4.10%, so this head & shoulders measurement would take the TNX down to this area of yield support.
This top in interest rates occurred close to one month ago. To understand which areas the big Wall Street firms are rotating to, I simply look at a 1-month summary of our Relative Industry Group ChartList, available to all of our annual members at EarningsBeats.com. Here are the groups most benefiting over the past month:
Trade what you SEE, not what you’re hearing. Most of the CNBC rhetoric is worthless. If you want to trade or invest with more success, you need to invest and trust in those interested in helping you succeed. CNBC wants you to watch or click. As brilliant as Jim Cramer is, he ain’t a market technician. He waffles more than IHOP. If the stock market goes up 5 days in a row, Jim’s as bullish as they get. And then we see a drop of 5 days in a row and Jim thinks the sky is falling. He has little conviction, which makes trading very difficult.
With that brief rant out of the way, look at the last month’s leading industry groups. All 10 are part of our three key aggressive groups – technology (XLK), consumer discretionary (XLY), and communication services (XLC). 7 of the top 8 industry groups are in the XLY. Ask yourself one simple question. Why are the big Wall Street firms pouring their resources into consumer discretionary stocks? If you were bracing for the nasty recession that all the talking heads keep yapping about, would you be jumping into discretionary stocks with both feet? This is how we are all brainwashed by the media. WAAAAY too much time is spent on the scary stories to drive up viewership and not nearly enough time is spent on educating the masses. You don’t pour your money into the very stocks that would be bludgeoned by a recession. Instead, Wall Street is prepping for a very bullish move and you should too.
The top group, by a mile, is home construction ($DJUSHB). It’s somewhat counterintuitive, but you need to keep historical tendencies in mind. While you might think that the colder winter months might lead to an underperforming DJUSHB, the opposite is actually true. Check out the DJUSHB historical performance over the past 20 years:
Now you might understand why Wall Street is secretly moving into home construction stocks. Yes, mortgage rates are dropping, but this is a 20-year history of relative performance. From the above, here are your three best months of relative performance of home construction:
January: averages outperforming the S&P 500 by 3.8%December: averages outperforming the S&P 500 by 2.7%November: averages outperforming the S&P 500 by 1.8%
That’s total average outperformance for these 3 months of 8.3%. The other 9 months COMBINED average UNDERperforming by 4.8%. I cannot overstate the importance of historical knowledge.
I am still offering FOR FREE critical historical stats of the S&P 500. You’re not going to see this on CNBC. I doubt you’re going to see it anywhere. But we do A LOT of historical research at EarningsBeats.com and this information will help you trade/invest more successfully. Simply CLICK HERE and download this 7-page PDF. It’s yours totally FREE.
Happy trading!
Tom