
Right around the turn of the 20th century, financial pioneer Charles Dow developed a very simple and straightforward way to determine the trend in any market, one I’ve mentioned on The Final Bar more times than I can count. Namely, an uptrend is a pattern of higher highs and higher lows.
So as the S&P 500 finishes this week just barely above the crucial 4400 level, propelling our main equity benchmark to a new swing high, I definitely took notice. So what makes this level so meaningful, and what else would we need to see to validate this breakout?
Higher Highs Are Bullish
As legendary technical analyst Paul Montgomery used to say, “the most bullish thing the market can do is go up.” We can debate potentially bearish macroeconomic factors, such as elevated interest rates, a somewhat still hawkish Fed, and an escalating situation in the Middle East, but the equity markets remain resilient regardless. And given the choice of following bearish macro themes or rising stock prices, I’ll go with rising stock prices any day!
But instead of just taking a cursory glance at the chart to assess trend direction, Charles Dow gave things a little more structure by focusing on the peaks and valleys in the price action. A market is bullish if it makes new swing highs, and subsequent pullbacks do not eclipse the previous low. Higher highs and higher lows are bullish.
So the S&P 4400 is a key level in our assessment because a move above this level would mean a new swing high for the first time since July. And that would suggest that bulls may be finally regaining control of this languishing market for stocks.
Now Presenting the “Stoplight Technique”
Technical analysis is essentially a set of data visualization techniques to illustrate investor behavior. And when a chart is hovering between a key resistance level like 4400 and a major support level like 4200, we can use a “stoplight technique” to better visualize where the price sits between these two crucial levels.
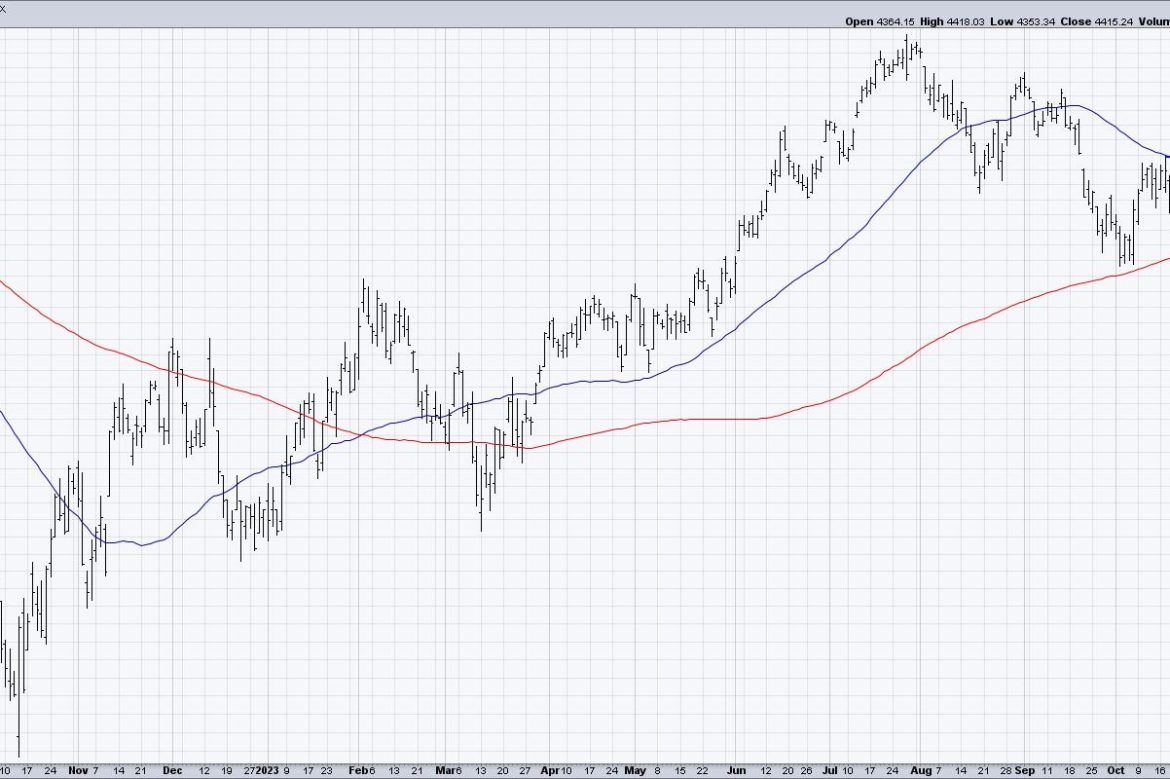
You can see from this chart that 4400 is not only meaningful because it represents a new swing high, but because it also would take the S&P 500 above a trendline using the highs in July, August, and September. So a validated breakout (see the section below!) would take the SPX out of the neutral yellow area and into the bullish green region.
On the other hand, a break below 4200 would take the S&P into the bearish red area. This would mean the price would have broken back below the 200-day moving average, and suggest a retest of the late October low around 4100. One of my mentors used to say, “All large losses begin as small losses.” So the biggest concern after a break below 4200 is that the downside objective could end up being much, much lower!
It’s All About the Follow-Through
With Friday’s strong upside day, the S&P 500 ended the week around 4415. So why aren’t we signaling an “all clear” bullish sign for stocks?
I think of any technical signal as occurring in three distinct steps: the setup, the trigger, and the confirmation. The setup is where you see a pattern emerging, in this case the market approaching a retest of the October swing high around 4400. The trigger occurred on Friday’s close, where the price actually closed above this crucial resistance level. Now it’s all about the confirmation, which means some sort of follow-through to validate the buy signal.
Some technical analysts would look for a move of a certain percentage above the key level, or a higher close the next day, or even just a higher intraday high. I tend to look for an additional close in the direction of the breakout, showing that additional buyers have come in and are willing to pay even more for the particular asset.
In other words, we are looking for the price to move not just to resistance but through resistance.
When the market reopens on Monday, I’ll be looking for additional upside for the S&P 500 to complete the bullish rotation above 4400. I’m encouraged by the fact that the Nasdaq 100 has already made a breakout move to the upside, yet I’m discouraged by a bearish interest rate environment, a hawkish Fed, and the fact that strong performance still seems fairly focused in a couple of growthy sectors.
But at the end of the day, the market doesn’t care what we think. The market is always right. And if prices are going higher, I want to be bullish!
RR#6,
Dave
P.S. Ready to upgrade your investment process? Check out my free behavioral investing course!
David Keller, CMT
Chief Market Strategist
StockCharts.com
Disclaimer: This blog is for educational purposes only and should not be construed as financial advice. The ideas and strategies should never be used without first assessing your own personal and financial situation, or without consulting a financial professional.
The author does not have a position in mentioned securities at the time of publication. Any opinions expressed herein are solely those of the author and do not in any way represent the views or opinions of any other person or entity.