
One of the widgets/panels I have on my dashboard is SCTR Reports. One of the options to visualize the group of SCTRs is to show an RRG. Depending on your choice of which SCTRs you want to see, this combination of SCTR rankings and Relative Rotation Graphs can help you find great trade ideas.
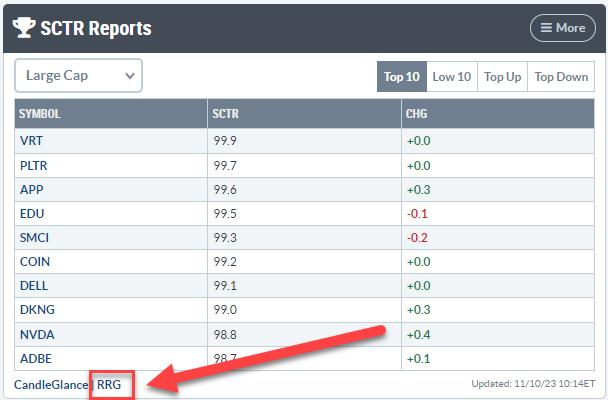
In this example, I am looking at the SCTR report that shows the top 10 SCTR stocks for the large-cap universe on Friday, 10 November.
By clicking on the RRG Link in the bottom left of the panel, I can open up a Relative Rotation Graph that holds these 10 stocks and uses $SPX as the benchmark.
Unleash the Power of RRG on Top SCTRs
Not surprisingly, all these stocks are on the right-hand side of the RRG. They are the strongest stocks in the universe! But by plotting them on a WEEKLY Relative Rotation Graph, you can see distinct differences between the various tails.
first, the two tails inside the leading quadrant are heading straight down towards the weakening quadrant. This does not necessarily make them bad stocks but they are going through a setback from a relative perspective.
Then, two stocks inside the weakening quadrant are moving on a negative RRG-Heading, powered by long tails. Again, they are not necessarily bad stocks, but they are unlikely to rapidly turn around and start outperforming the universe at short notice. SMCI is a bit of an outlier. Inside the weakening quadrant, picking up in terms of JdK RS-Momentum but still losing relative strength (JdK RS-Ratio).
The group of tails inside the green oval looks more interesting. These are tails that have completed a rotation through weakening but are now heading back up to leading without having crossed over into the lagging quadrant.
Zooming in
Here is the RRG with these stocks isolated and fitted to the RRG to maximize screen real estate.
When zoomed in, we can see that ADBE and NVDA are moving at an RRG-Heading around 270 degrees (due West), i.e., not moving back up toward the leading quadrant (yet).
Moving to Daily RRG
The relative strength is clearly visible when plotting these five symbols on a DAILY RRG. All five are moving rapidly (back) into the leading quadrant at strong RRG-Headings.
Getting Up Close and “Individual”
It’s time for a closer look at the price chart “up close and individual.”
I started doing my analyses on the daily charts but, halfway through, realized that the weekly charts of these stocks are showing pretty strong breaks, so I decided to annotate these instead of the dailies. Just click on the weekly chart in the article and then switch to daily for a closer look. But I bet you figured that out already 😉
NVDA
NVDA seemed to break below the neckline, marking the bottom of a large H&S top formation two weeks ago. However, it very rapidly recovered back above the neckline. This caused a “failed H&S top, ” one of the strongest signals you can get.
The initial higher thrust is already well underway, and NVDA is now pushing against resistance from the previous high. When the market can hold above this level (476), an attempt to challenge the all-time high at 500 is very likely.
ADBE
ADBE is breaking out of the three-month sideways consolidation as it eliminates the overhead supply that has kept the stock under pressure. With that supply now gone, there is little or no hurdle to prevent ADBE from testing resistance in the area of its all-time high between 675-700.
With risk/support limited to the breakout level near 575, that is a pretty good risk/reward ratio.
PLTR
Palantir is taking out the resistance around 18.25. The next hurdle is found near 20. Passing that area will open up the way for much more upside potential as the stock is completing a large base.
COIN
Here’s another big base in the making. After losing more than 80% of its value since the IPO, COIN started to consolidate between 35 – and 117. It’s a very tradable range, but still a range in the grand scheme of things.
Since August, a narrower range has developed between 70-86. At the moment, COIN is breaking away from this range and making its way to the upper boundary of the larger base, near 117. This, in itself, is already a very tradable move: 93 to 117 with support/stop around 86.
But a more meaningful move can be expected when COIN takes out overhead supply near 117 as it will then complete the large, > 1-year base. Projecting the height of the base (117-35=82) on top of the breakout level provides a price target near 200. Which coincides with the lows of 2021 and the highs after breaking lower) of 2022.
That’s an upward potential of 70%, which should be worth a bit of attention.
DKNG
DKNG completed its base formation in July and subsequently tested the breakout level as support twice. Initially threatening to form a descending triangle, but that threat was mitigated last week by a fierce rally that took DKNG back to its last high, near 34.50. And it looks as if we are breaking higher this week.
If we can hold this breakout level next week, DKNG looks ready to move further.
#StayAlert and have a great weekend. –Julius