
Correlations rise during bear markets. This means more stocks participate in broad market declines than broad market advances. In other words, the odds are stacked against us when picking stocks in bear markets. Traders are better off looking outside of the stock market for opportunities.
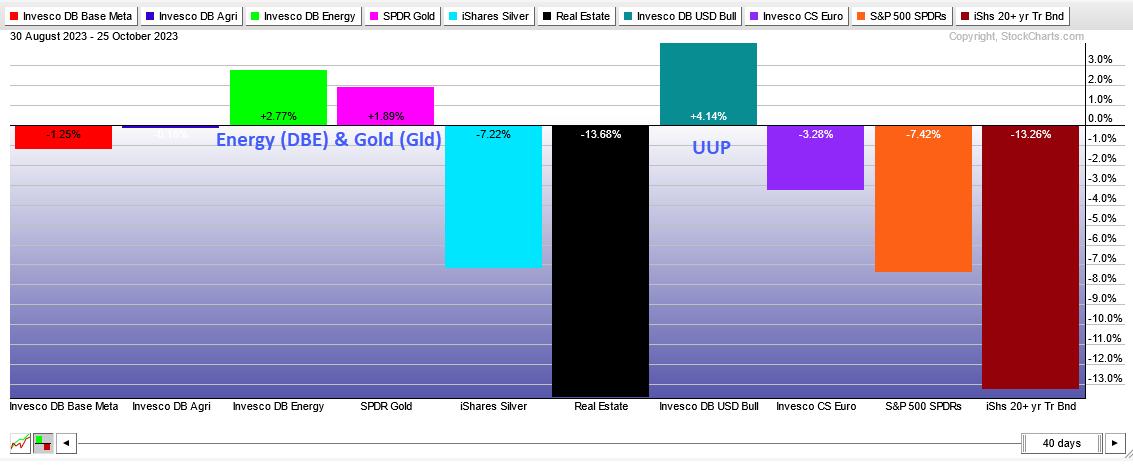
The Perfchart below shows the performance for 10 asset-based ETFs over the last forty days. Seven of the ten are down with Silver, REITs, the S&P 500 SPDR and the 20+ Yr Treasury Bond ETF leading the way lower. Three stand out. The DB Energy ETF (DBE), the Gold SPDR (GLD) and the Dollar Bullish ETF (UUP) are all higher.
Chart Trader featured weekly charts for oil and gold in Thursday’s report and video. Let’s take a look at the US Oil Fund (USO), which is forming a short-term bullish continuation pattern. USO broke out with a big advance from July to September. The Trend Composite turned positive on July 24th and confirmed this trend reversal.
Short-term, the ETF became overbought in late September and fell back in early October. This decline, while sharp, held above the breakout zone so the breakout remained intact. USO went on to consolidate with a pennant, which is a short-term bullish continuation pattern. A breakout would signal a continuation higher and target a move to the upper 90s.
Today at Chart Trader:
Measured Move Target for SPYFundamentals Show A Perfect StormQQQ Reverses UpswingRussell 2000 ETF Remains the WeakestGold Goes for Another BreakoutUS Oil Fund Consolidates after BreakoutOil & Gas Equipment & Services ETF Hits Reversal ZoneNatural Gas Futures versus the ETNNike Hits Resistance Zone
Reports and videos are published every Tuesday and Thursday. Click here for immediate access.
//////////////////////////////////////////////////