
RRG is Sending a Clear Message And Finds Two Stocks With Good Upside Potential
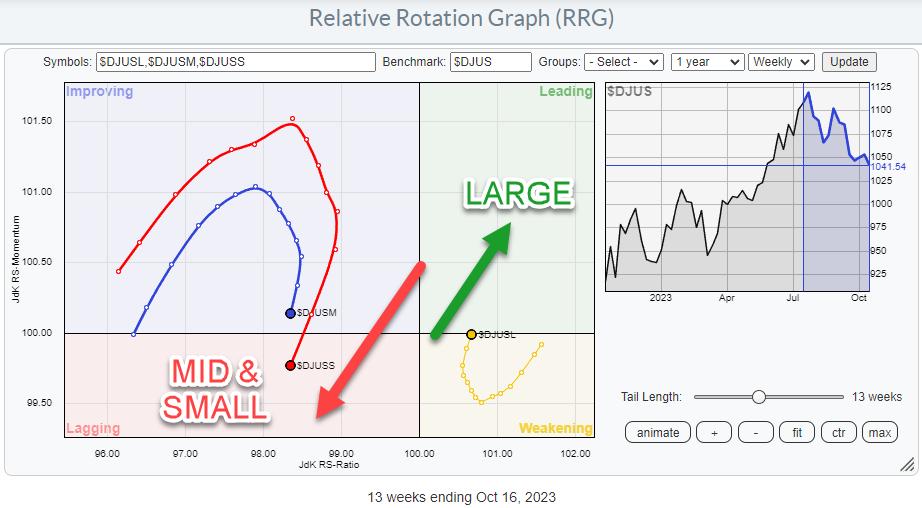
The Relative Rotation Graph above could not be more clear. Large Caps are leading the dance at the moment.
The rotations of the tails for Mid- and Small-cap stocks are rolling over and entering the lagging quadrant again. This means that they are embarking on a new leg lower in an already existing relative downtrend.
The opposite goes for the Large Cap tail, which has just curled back up inside the weakening quadrant and is now heading back into the leading quadrant.
Stacking the Three Size Indices
This can also be seen very well by just eye-balling the charts when we plot all three indices under each other.
From the lowest point in the large-cap chart, Large caps are still almost 8% higher than where they started at the end of April. Mid-caps and Small-Caps are pretty much unchanged at +0.2% and 0.1%.
Measuring the decline from the highest point in the last week of July, Large caps are down 6.4%, while Mid-caps are down almost 10% and Small-caps almost 12%.
So, despite the current weakness in all market segments, Large-caps are still preferred over the mid-and small-cap segments. Btw this does not imply that prices are, or will be, going up!! It only signals that large caps are the better place to hide at the moment.
Growth vs Value Broken Down into Size Segments
When we break down the Size segments into Growth and Value, things get more interesting.
In the RRG above, you see the rotations for Growth and Value segments, broken down into the three size segments. And the resulting image is sending a very clear message. Large-cap growth stocks are leading the market. Again, be careful. This does not mean their prices are, or will be, going up. It only signals that this is currently the strongest segment in the market from a relative perspective.
The Rotational Picture In Price Terms
Plotting this universe of indices against $ONE gives an entirely different picture.
All these tails are at a negative heading and inside or moving toward the lagging quadrant. This indicates that all segments in the market are going down in price. The only slight positive on this RRG is the $DJUSGL tail, which has started to curl up a little before closing in on the lagging quadrant.
Finding Tradeable Opportunities
Now, to find tradeable opportunities, I looked up all the members of the IVW ETF, iShares S&P 500 Growth.
You can find this information here. Then, save all the symbols in a ChartList for further processing. This list holds all the stocks that, according to S&P Global, are considered “Growth” stocks. It is interesting to see plenty of stocks on the list from sectors not necessarily seen as “Growth.”
As the list holds> 200 symbols, we need to do some cleaning to narrow it down to a more manageable number.
Trimming the list
Assuming we are looking for stocks going up in price, to begin with, so not necessarily ONLY looking for relative strength, I put the list in the scan engine. I added the requirements for stocks to be above their 5-day AND 20-day moving averages.
This brings the list down to 23 stocks (around 11 am on Friday, 10/20). Adding the requirement that the 5-day MA be above the 20-day MA trims the list to 18 stocks.
Here is the RRG for that group.
Given my requirements for the scan, it is no surprise that all those tails are pointing northeast on the daily RRG.
Another interesting observation is that there are no Technology or Communication Services stocks on this list. At the same time, these sectors show the strongest positive rotation on a sector level. Most names are in the so-called defensive sectors (Utilities, Health Care, Staples)…
So while Large Cap Growth Stocks are leading the dance, it’s primarily the “growth” stocks that are inside the “defensive” sectors…
Get the weekly perspective.
To get the longer-term perspective, I changed the RRG to weekly, which gives this image.
A few symbols are getting less interesting as they are on a negative RRG-Heading.
In the next pass, I disabled the tails that are not on a positive RRG-Heading (0-90 degrees)
All of these stocks are worth a bit more research.
Two Interesting Stocks
Combining the weekly RRG with the daily version at the top of the article puts NOC and LMT at the forefront. However, looking at their charts, we can see that both have already made a big jump, making them a bit riskier to chase as they already have had a big move up, not a good risk/reward profile.
After going over the chart, I came up with two stocks that look interesting to me.
McKesson – MCK
The first one is MCK. This stock is in a strong uptrend on the weekly chart, pushing to new all-time highs, while relative strength is also pushing to new highs, pushing both RRG-Lines above 100 and the RRG-tail deeper into the leading quadrant.
This strong rotation is confirmed by the daily RRG-tail, positioned inside the weakening quadrant but heading back toward the leading quadrant.
Corteva – CTVA
CTVA has been in a strong downtrend since the end of 2022, both on the relative and the price charts. However, these downtrends seem to be coming to an end now.
On the price chart, CTVA has hit support around 48.50, potentially forming a double bottom. This formation will execute when resistance near 53.50 will be taken out. The next target will be the falling resistance line that marks the upper boundary of the falling channel in which CTVA still sits. Currently, that level lies near 55.
From a relative perspective, CTVA is in a similar situation, although it looks as if the falling resistance has already been cleared. And the small double bottom is about to execute as well.
Therefore, picking this up around current levels will likely put you in good shape from a relative perspective. The price chart is a bit more challenging, and depending on your level of aggressiveness or risk appetite, the execution of the double bottom, taking out the falling resistance, can be used as a trigger to enter.
#StayAlert and have a great weekend, –Julius