
Nasdaq 100 (QQQ), Communication Services (XLC) and Transports (IYT) New Bullish Bias in IT
The Silver Cross Index is another way for us to measure participation within an index, sector or industry group. It tells us how many stocks have a “Silver Cross” or a 20-day EMA above its 50-day EMA. When it moves above or below the signal line it is a “Shift”. The Golden Cross Index measures what percentage of stocks hold a 50-day EMA above the 200-day EMA. We’ll concentrate on the Silver Cross Index in this article.
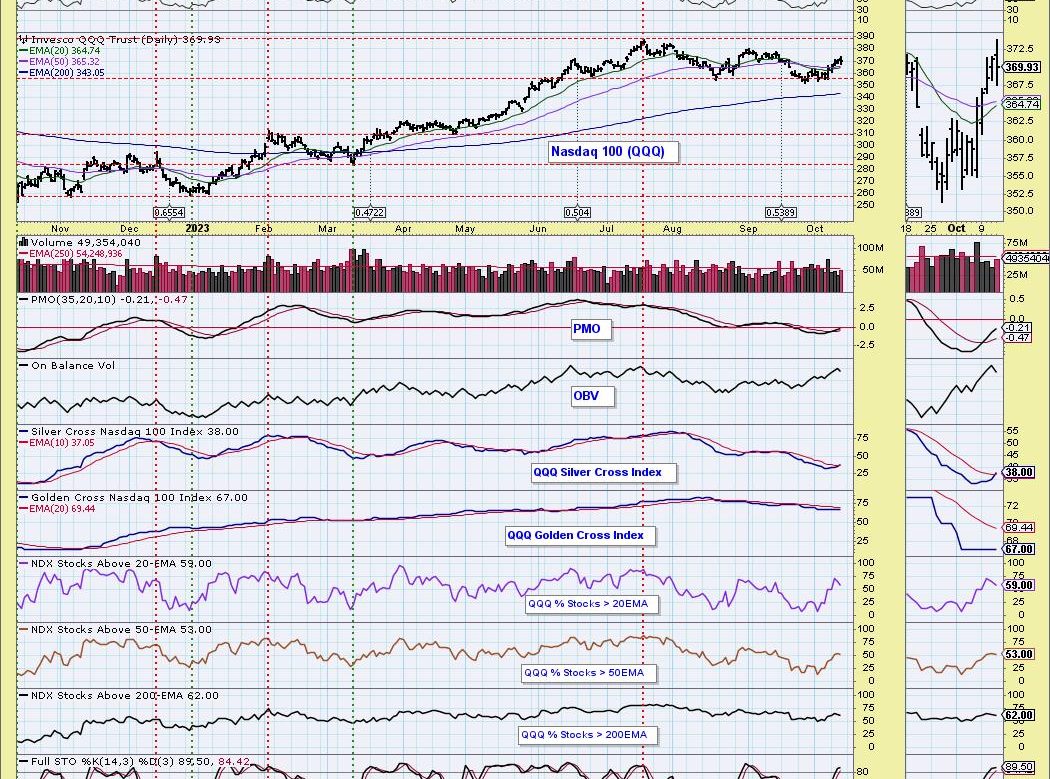
Today the QQQ’s Silver Cross Index had a “Bullish Shift” as it crossed above its signal line (10-EMA). We also saw Communications Services (XLC) and Transports (IYT) have the same Bullish Shift. This moves the IT Bias to “Bullish”. We thought we would look at the charts to determine if these are good signals or not.
We like the QQQ’s chances of moving higher given the expansion in participation of stocks above their 20/50-day EMAs. The long term is a little murky given the Golden Cross Index is still in decline and %Stocks > 200-day EMA are also in decline. The RSI is positive and the PMO is rising on an oversold Crossover BUY Signal. Stochastics are also above 80. Look for the QQQ to move higher after a short cooling off period.
XLC had a terrible day, but we didn’t see that much damage to %Stocks > 20/50/200-day EMAs. The other indicators are still healthy as well, but we aren’t thrilled with the drop below the prior September high. The Silver Cross Index is oversold and it is rising quite strongly given today’s decline. Under the hood XLC looks like it could see an upside reversal.
We aren’t very bullish on IYT despite today’s Bullish Shift on the Silver Cross Index. %Stocks > 20/50/200-day EMAs are in decline and never really reached our bullish 50% threshold. Price fell at overhead resistance at the 200-day EMA almost as soon as it broke the declining trend. Relative strength is terrible so even if we get a reversal back up, there are likely far better areas of the market to pluck.
Conclusion: The Silver Cross Index and Golden Cross Index are another way to look at participation. DecisionPoint.com has the Silver Cross Index and Golden Cross Index for all major indexes, all of the sectors and select industry groups. Below is our current Bias table that we publish daily in the DecisionPoint Alert. Biases are still very bearish in the long term, but we are beginning to see some improvement on IT Biases. This suggests to us that we have likely hit a significant price bottom in the market.
Learn more about DecisionPoint.com:
Watch the latest episode of DecisionPoint on StockCharts TV’s YouTube channel here!
Try us out for two weeks with a trial subscription!
Use coupon code: DPTRIAL2 at checkout!
Technical Analysis is a windsock, not a crystal ball. –Carl Swenlin
(c) Copyright 2023 DecisionPoint.com
Disclaimer: This blog is for educational purposes only and should not be construed as financial advice. The ideas and strategies should never be used without first assessing your own personal and financial situation, or without consulting a financial professional. Any opinions expressed herein are solely those of the author, and do not in any way represent the views or opinions of any other person or entity.
DecisionPoint is not a registered investment advisor. Investment and trading decisions are solely your responsibility. DecisionPoint newsletters, blogs or website materials should NOT be interpreted as a recommendation or solicitation to buy or sell any security or to take any specific action.
Helpful DecisionPoint Links:
DecisionPoint Alert Chart List
DecisionPoint Golden Cross/Silver Cross Index Chart List
DecisionPoint Sector Chart List
Price Momentum Oscillator (PMO)