
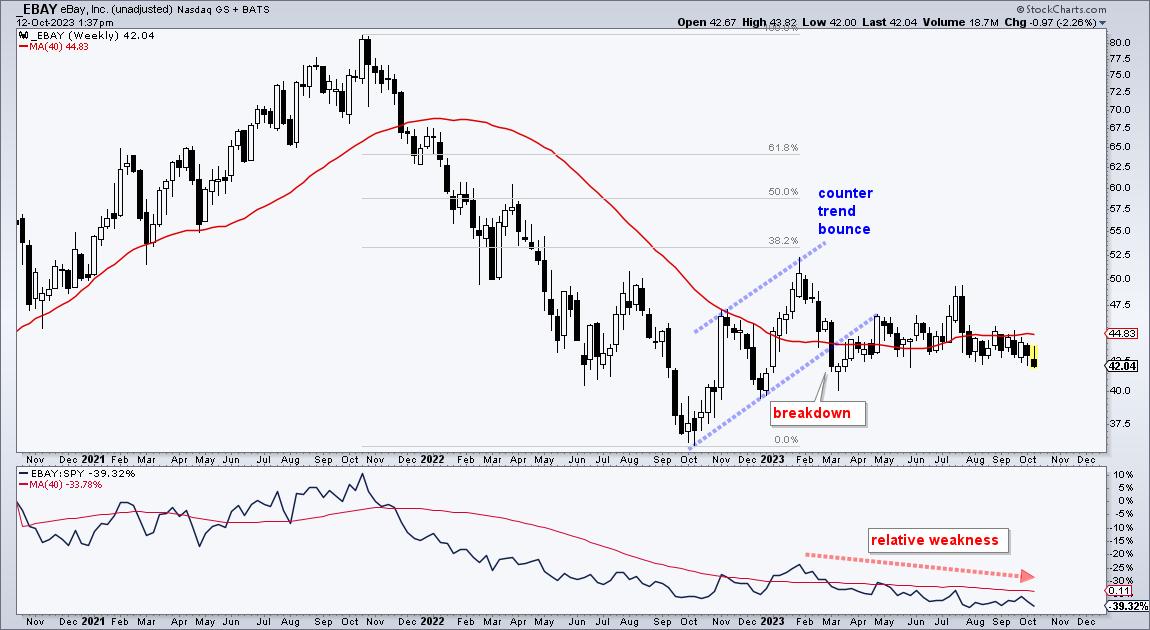
Despite a rough ride in September, the S&P 500 is still up 14% year-to-date and the Nasdaq 100 is up a whopping 40%. The gains here, however, do not tell the entire story because many stocks are struggling in 2023. In fact, around half of the stocks in the S&P 500 are up year-to-date and half are down. EBAY is up less than 2% year-to-date and looks poised to turn negative.
The first chart shows weekly candlesticks with the 40-week SMA and the price-relative (EBAY:SPY ratio) in the indicator window. Long-term, EBAY fell some 50% from October 2021 to October 2022 and then bounced with a rising channel. This channel retraced around 38.2% of the prior decline and EBAY broke the channel with a sharp decline in early March. Even though the stock stabilized after this “breakdown”, it never escaped the gravitational pull of the 40-week SMA (red line) and underperformed the broader market.
The next chart shows daily candlesticks and a breakdown in the making. The stock broke the lower trendline of a rising channel in July and then firmed with a triangle. A triangle after a sharp decline is typically a bearish continuation pattern. It represents a consolidation that alleviates oversold conditions. Stocks are up in October, but EBAY is not participating because it broke the triangle line and exceeded its August lows. This signals a continuation lower and I would expect new lows from EBAY. A close above the 200-day SMA would call for a re-evaluation.
This week on Chart Trader we weighed the long-term evidence for stocks and put forth targets for the oversold bounce in SPY and QQQ. We are still highlighting long setups and trading ideas, but these are limited to stocks in strong groups. Click here for immediate access to our reports and videos.
//////////////////////////////////////////////////