
Chartists looking to get the jump on a bigger breakout can turn to the swings within a developing pattern. For example, a Symmetrical Triangle after an advance is a bullish continuation pattern. We can get the jump on a breakout by trading a downswing reversal within the pattern. Let’s look at an example using the Software ETF (IGV).
Note that I featured the Software ETF (IGV) on September 28th and October 10th in the Chart Trader Report and Video. Click here to learn more.
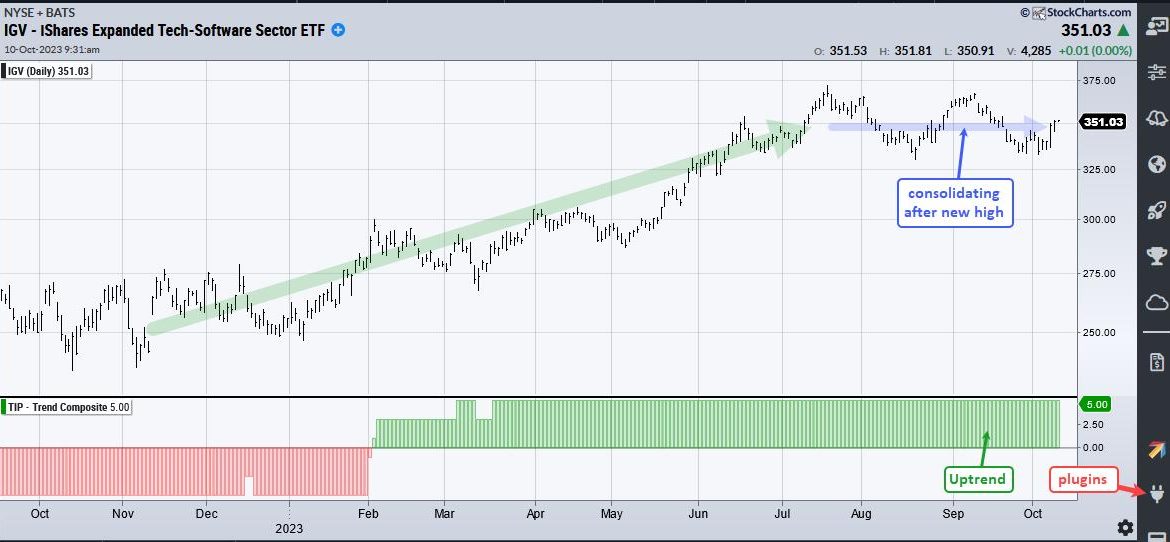
The first chart shows IGV advancing from November to July and hitting new highs in July. In the bottom window, the Trend Composite turned positive in early February and remains at +5, which means all five indicators signal uptrend. The Trend Composite is part of the TIP Indicator Edge Plugin for StockCharts ACP.
IGV peaked in July and moved into a consolidation the last few months. A consolidation within an uptrend is typically a bullish continuation pattern that represents a rest within the trend. The blue lines on the next chart show a Symmetrical Triangle forming and a breakout would signal a continuation of the long-term uptrend.
The green and red dashed lines show the swings within this pattern. The swing was down in September and IGV reversed this downswing with a short-term breakout here in October. This breakout is the early clue that IGV is ready to move higher and break out of the Symmetrical Triangle. And finally, notice that the Momentum Composite became oversold in late September with a dip to -3. A short-term oversold condition within an uptrend is often an opportunity.
Chart Trader at TrendInvestorPro features setups like these for ETFs and stocks. We are looking for names that are in leading uptrends and forming bullish continuation patterns. Reports and videos also feature broad market analysis and group work to find the leaders. Click here to learn more and gain immediate access.
//////////////////////////////////////////////////