
QQQ remains well above the rising 200-day SMA, but clearly shifted from bullish to bearish over the last two months. Today’s report/video will show this momentum shift and analyze the short-term continuation pattern taking shape.
A Key Momentum Indicator Shifts from Bullish to Bearish for QQQ
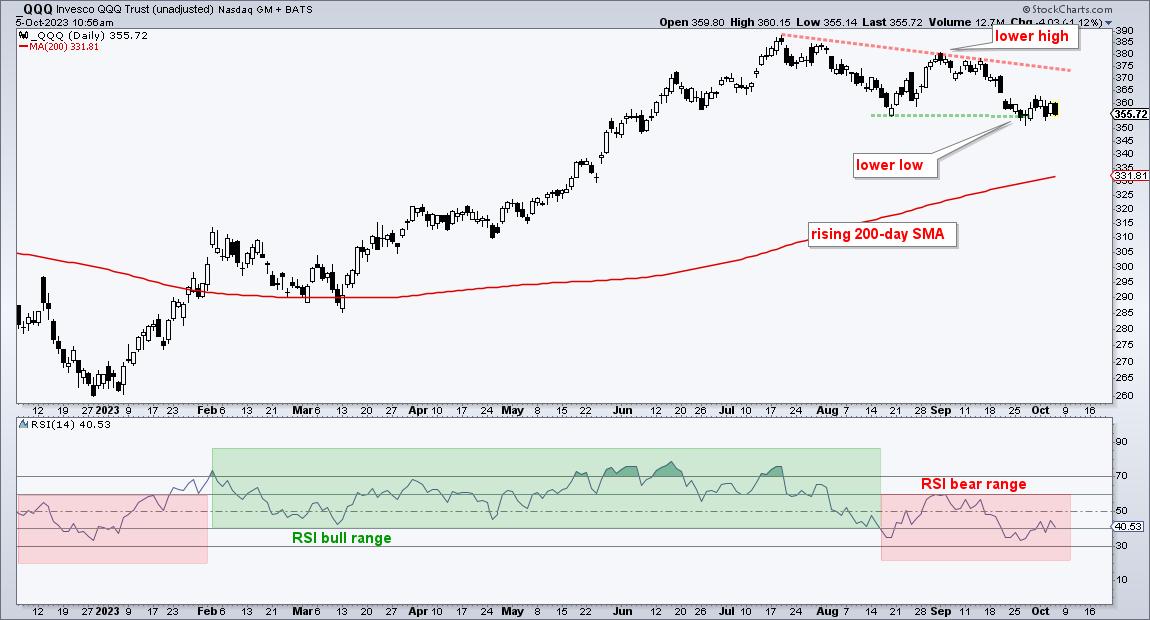
The chart below shows QQQ trading well above the rising 200-day SMA. We could make the case for a long-term uptrend, but the immediate trend is down. QQQ formed a lower high from July to September and a lower low from August to September. As far as I am concerned, the path of least resistance is down.
I am also bearish because RSI shifted from a bullish range to a bearish range. RSI typically ranges from 40 to 80 during uptrends (green shading) and from 20 to 60 in downtrends (red shading). Notice how RSI broke above 60 in mid January and then ranged from 40 to 60 during the bull run from mid January to mid August. RSI broke this range in mid August and the 50-60 zone becomes momentum resistance (red shading).
Short-term, QQQ fell sharply in September and then consolidated with a pennant taking shape. Pennants are short-term continuation patterns that get their trading bias from the prior move, which was down. This pennant is a bearish continuation pattern and a break would target a move towards the 200-day SMA. I covered this pennant in Thursday’s Chart Trader report and video.
This week in Chart Trader: We introduced a short-term breadth model designed to identify oversold conditions and signal upturns. It is currently oversold and remaining oversold. Each Chart Trader report and video also includes trading setups for stocks and ETFs. An 8-day trial is available.
—————————————