
The pockets of strength are shrinking as more stocks succumb to selling pressure. The Nasdaq 100 is the strongest of the major indexes, while the Finance sector is one of the weakest sectors. Today’s report will highlight two leaders within the Nasdaq 100 and two laggards within the finance sector.
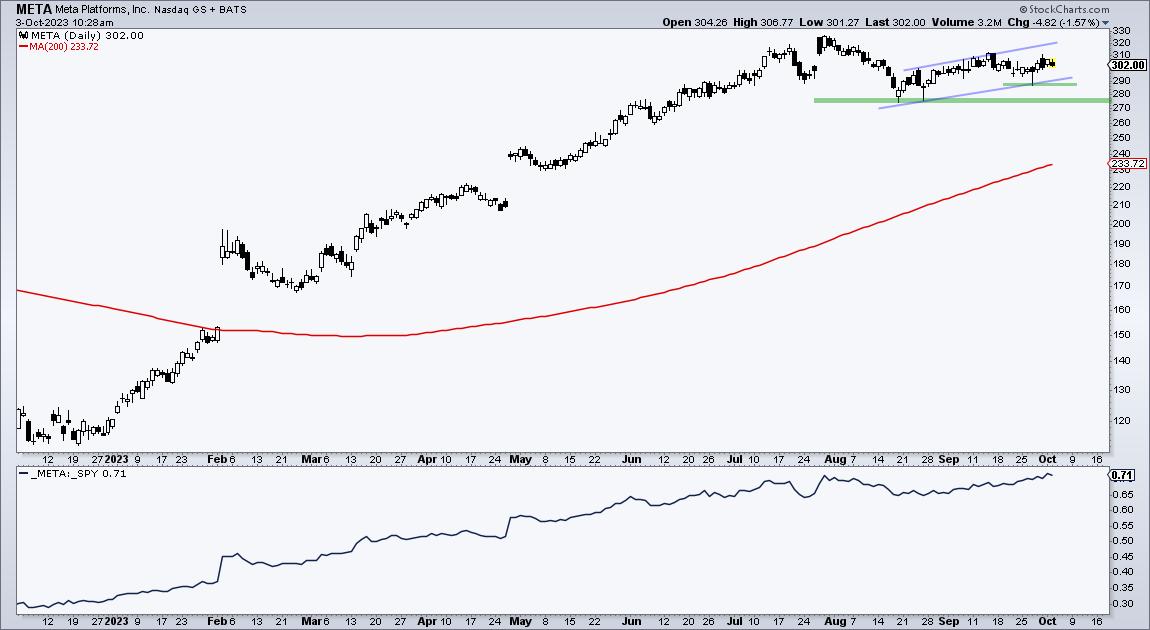
The first chart shows Meta Platforms (META) within a strong uptrend and well above its rising 200-day SMA. META fell in August and then rebounded the last six weeks. It remains above its August low and a leader. The blue lines mark a rising channel with support at 287. A break there would reverse this upswing and target a move toward the rising 200-day. META was featured in Chart Trader last week.
The next chart shows Mastercard (MA) hitting a new high in September and then falling the last three weeks. MA remains above its August low and still in an uptrend. The S&P 500 SPDR (SPY), in contrast, broke its August low. I am watching META and MA because they are leaders and are holding up. It would be negative if these leaders break their August lows.
The next chart shows Goldman Sachs (GS) breaking its August lows and leading lower. The stock fell sharply from early February to mid March and then worked its way higher into early August. This looks like a long corrective bounce and the breakdown signals a continuation lower. Relative and absolute weakness from Goldman cannot be positive for stocks.
And finally we have JP Morgan (JPM). The stock broke its August low in early September and then formed a pennant (blue lines). These are short-term continuation patterns and the prior move was down. This makes the pennant a bearish continuation pattern. JPM broke pennant support the last two days and the downside target is in the 132-134 area.
Check out Chart Trader at TrendInvestorPro for more technical analysis and setups like these. A one week trial is now available.
//////////////////////////////////////////////////