
Week Ahead: NIFTY Violates Important Levels; Stay Cautious And Selective In Approach
Although the market stayed flat on a week-on-week basis, the past five trading sessions showed all possibilities of the market continuing with its corrective retracement. In the previous technical note, it was categorically mentioned that India VIX had closed at a precariously low level, and that had left us vulnerable to profit-taking bouts. On Thursday, as the markets saw a strong profit-taking wave, VIX surged over 12% only to come down the other day. The trading range was narrower; the Nifty oscillated in the 274.55 points range before closing flat with a minor loss of 35.95 points (-0.18%) on a weekly basis. The monthly performance remained strong; despite coming off from the high point of the month, the headline index gained 384.50 points (2.00%) in September.
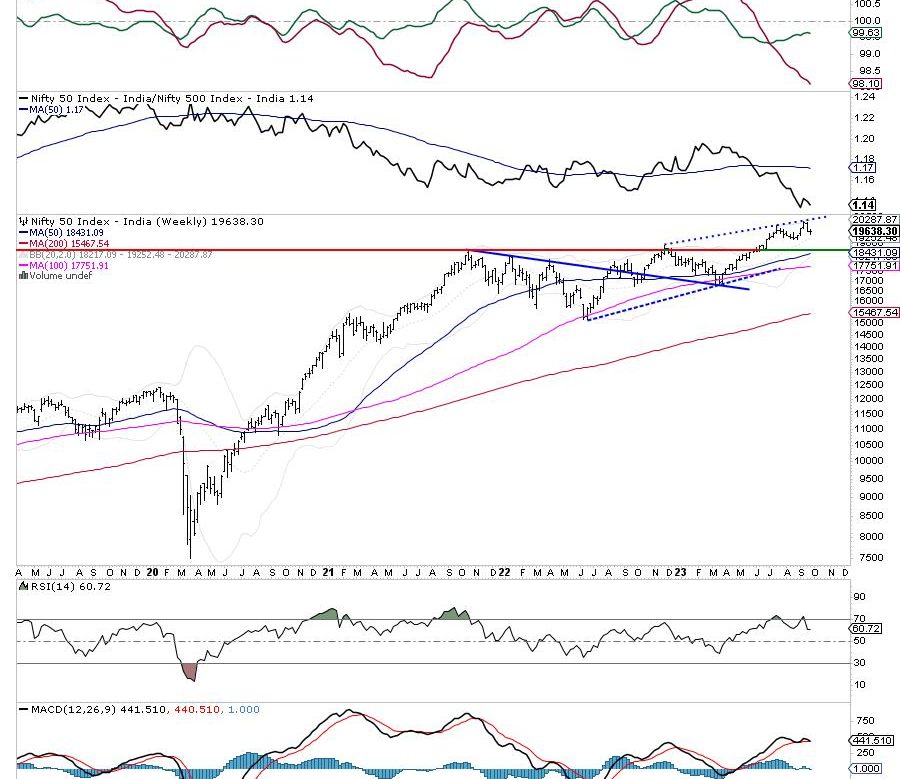
We have a four-day short trading week coming up; Monday is a trading holiday on account of Gandhi Jayanti. The Nifty has violated the important 50-DMA on the daily charts which currently stands at 19629. When the index attempted to stage a technical rebound on Friday, it ended up closing just below this important level which now acts as a resistance after getting violated on a closing basis. This is important from a technical standpoint; however, the Nifty has formed a lower top and lower bottom on the weekly charts. This shows a continuation of corrective retracement after the emergence of a potential top at 20222 levels. IndiaVIX, despite coming off sharply from its high seen on Thursday, still ends 7.43% higher at 11.45 as compared to the previous week.
The first trading session on Tuesday will see the markets aligning themselves with the global markets that would have traded on Monday. A tepid start to the week is expected; the levels of 19790 and 19850 are expected to act as resistance. The supports are likely to come in at 19500 and 19370 levels.
The weekly RSI stands at 60.72; following a bearish divergence earlier, it now stands neutral and does not show any divergence against the price. The weekly MACD is bullish as of now but it is on the verge of showing a negative crossover. A spinning top occurred on Candles; it reflects the indecisiveness of the market participants.
The pattern analysis of the weekly chart shows a simplistic picture; while the daily chart has some technical events on it, the weekly chart just shows a continuation of retracement following the creation of the top at 20222 levels. If the current retracement continues, we may see the Nifty drifting towards the 20-week MA which is placed at 19252 followed by the crucial pattern support of 19000 levels.
All in all, there are greater chances of the technical structure getting defensive in the markets. While we may see some catchup being attempted by Banknifty in the event of any technical rebound happening, we will see low beta and defensive space like PSE, PSU Banks, IT, Pharma, and FMCG/Consumption doing well. It is strongly recommended that leveraged exposures should be kept at modest levels; excess leverage should be avoided. Keeping in mind that volatility may increase sporadically and intermittently, a defensive and cautious outlook is advised for the coming week.
Sector Analysis for the coming week
In our look at Relative Rotation Graphs®, we compared various sectors against CNX500 (NIFTY 500 Index), which represents over 95% of the free float market cap of all the stocks listed.
Relative Rotation Graphs (RRG) show that Nifty Energy, Midcap100, Media, PSUBank, Metal, PSE, Pharma and Infrastructure indices are inside the leading quadrant of the RRG. Out of these groups, Metal, Pharma, Media, and Energy appear to be giving up on their relative momentum and may contribute less to the relative outperformance. However, while the other sectors may continue to relatively outperform the broader markets.
The Auto and Realty indices are inside the weakening quadrant and are seen mildly attempting to improve their relative momentum.
The Consumption and FMCG indices are inside the lagging quadrant showing mild improvement in their relative momentum. Besides this, the Financial Services and Banknifty continue to languish inside the lagging quadrant.
The Nifty Services sector index has just rolled inside the improving quadrant. Along with this, the IT and Commodities sectors are also inside the improving quadrant and may better their relative performance against the broader markets.
Important Note: RRG™ charts show the relative strength and momentum of a group of stocks. In the above Chart, they show relative performance against NIFTY500 Index (Broader Markets) and should not be used directly as buy or sell signals.
Milan Vaishnav, CMT, MSTA
Consulting Technical Analyst