
A Big Inflection Point in QQQ Nears; Bond Yields Test Top of Key Trading Range
If your gut is telling you that something big is brewing in the markets, don’t ignore it.
The relationship between interest rates and stocks is about to be tested, perhaps in a big way. Observe the tightening of the volatility bands (Bollinger Bands) around the New York Stock Exchange Advance Decline line (NYAD) and the major indexes. This type of technical development reliably predicts big moves.
Now that CPI and PPI are out of the way, investors are fretting about the Fed meeting on September 19-20. The fear, of course, is that the potential reacceleration of inflation, as implied by a reviving of the CPI and PPI numbers, will lead the central bank to raise interest rates again.
The outcome of the meeting is anyone’s guess. The European Central Bank recently raised rates, but hinted that it may be done with its hiking cycle. China’s central bank seems to be at the start of a new lower rate cycle in order to boost its economy. The real arbiter may be the U.S. Treasury bond market. And the place where a lot of the action may take place once bonds decide what to do next may be the large-cap tech stocks. Think QQQ.
First, let’s look at bonds.
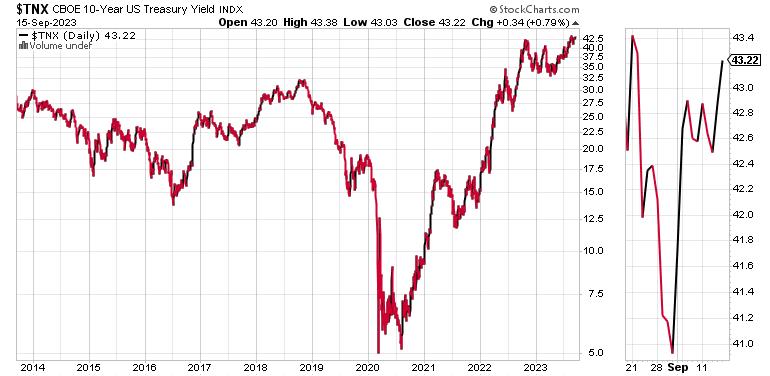
Are Bond Yields About to Make a Big Move Up?
Bond yields are on the verge of breaking above long-term resistance. Such a move, if it happens, would likely be meaningful for all markets; stocks, commodities, and currencies.
On the one hand, the most recent CPI and PPI numbers suggest inflation may be reviving. On the other, the anecdotal data, such as the Fed’s Beige book, ISM, and PMI data, paint a picture of a sluggish economy, or at least one that is not growing too rapidly. Recent data from the University of Michigan reports declining inflationary expectations from the public. Other data points vary widely on a monthly basis. The Wall Street consensus view is that we have stagflation, the combination of a stalling economy and simultaneously rising inflation.
Bonds hate inflation. But the response of bond yields to the most recent inflation numbers was not particularly scary. This suggests that at least some traders are starting to wonder if the odds of a stalling economy aren’t higher than those of one with runaway inflation.
A long-term examination of the value of TNX offers a glimpse into the importance of the moment. The reference point is the recent high in the U.S. Ten Year Note yield (TNX) of 4.37%, reached on 8/23/23. The previous high was 4.28%, reached on 10/22.
As of 9/15/23, despite signs that inflation may be rekindling, bond yields have not broken above the 10/22 highs. When this trading range is decided, up or down, the ramifications for the stock market will range far and wide.
QQQ is Poised for a Big Move
A natural place to look for big moves in response to interest rate trends is the interest-rate sensitive areas of the market. This includes homebuilders, real estate investment trusts (REITS), and utilities. I cover real estate, and housing in detail here.
Yet an often overlooked area which is quite sensitive to interest rates is the large-cap technology sector. Large-cap stocks matter because popular and heavily weighted S&P 500 (SPX) and Nasdaq Composite index (COMPQ) stocks, such as AAPL, MSFT, NVDA, and TSLA, are also housed in the Invesco QQQ Trust (QQQ). Given the widely held status of these stocks, when QQQ moves, the market pays attention.
Here is what’s important. First, QQQ is currently testing the important $370 price support area. If the ETF breaks below $370, it could fall to the $360 area, or even to $350. $370 is important because it is both where the 20-day moving average and a very large Volume by Price bar (VBP) reside.
VBP bars indicate price areas where bulls and bears are fighting for dominance of the trend. When prices rise or fall above these bars, it usually means a change in the trend has arrived. The combination of the 20-day and the VBP bar at $370 is a doubly important indication of that price level. A look at the Accumulation/Distribution line (ADI) shows that short sellers are not very active in QQQ. You can see a similar picture in On Balance Volume (OBV), which suggests sellers are not overwhelming buyers currently.
The take-home message is that $370 is a very important price point for QQQ. If prices fall below $370 and ADI and OBV turn lower, it will be an indication that lower prices in QQQ are likely. In addition, given the stocks that are housed in QQQ, a big drop in this ETF could spread throughout the market via their influence on major indexes.
Inside QQQ, one stock that is showing quite a bit of relative strength is Tesla (TSLA). The shares have been moving up steadily over the last month and may be ready to challenge the $290-$300 area. ADI and OBV for TSLA are also holding up. If you’re a Tesla fan, you should read this.
One final thought; the Bollinger Bands for QQQ are closing in on current prices. This is a highly reliable predictor that a big move is coming.
Join the smart money at Joe Duarte in the Money Options.com. You can have a look at my latest recommendations FREE with a two week trial subscription. And for frequent updates on the technicals for the big stocks in QQQ, click here.
The Market’s Breadth and Major Indexes Remain in a Tight Volatile Range
The NYSE Advance Decline line (NYAD) is going nowhere, but is doing so in a volatile fashion. Over the last three weeks, NYAD has crisscrossed above and below its 20- and 50-day moving averages, but has neither broken out or broken down. The net effect is that the Bollinger Bands are tightening, as in QQQ above. And that means that a big move in the market is coming, likely affected by whatever the Federal Reserve says and does next week.
The Nasdaq 100 Index (NDX) is caught in the same type of narrow trading range as NYAD. Again, the key is the 15000 where there is a cluster of Volume by Price bars (VBP) and the 50-day moving average. Accumulation/Distribution (ADI) and On Balance Volume (OBV) remain stable.
The S&P 500 (SPX) is trading between 4350 and 4600. As with NDX, there is a cluster of VBP bars and 20- and 50-day moving averages in the area, which means this will be an active trading range. It’s worth noting that ADI is weakening here, which suggests short sellers are moving in. OBV is holding steady, though, which means we could be setting up for another short squeeze.
VIX Remains Below 20
VIX remains subdued below the 20 area. This is still good news, but has not had much of an effect on the market. A move above 20 would be very negative.
When the VIX rises, stocks tend to fall, as rising put volume is a sign that market makers are selling stock index futures to hedge their put sales to the public. A fall in VIX is bullish, as it means less put option buying, and it eventually leads to call buying, which causes market makers to hedge by buying stock index futures. This raises the odds of higher stock prices.
Liquidity Remains Stable
Liquidity is stable. The Secured Overnight Financing Rate (SOFR), which recently replaced the Eurodollar Index (XED) and is an approximate sign of the market’s liquidity, just broke to a new high in response to the Fed’s move. A move below 5.0 would be more bullish. A move above 5.5% would signal that monetary conditions are tightening beyond the Fed’s intentions. That would be very bearish.
To get the latest information on options trading, check out Options Trading for Dummies, now in its 4th Edition—Get Your Copy Now! Now also available in Audible audiobook format!
#1 New Release on Options Trading!
Good news! I’ve made my NYAD-Complexity – Chaos chart (featured on my YD5 videos) and a few other favorites public. You can find them here.
Joe Duarte
In The Money Options
Joe Duarte is a former money manager, an active trader, and a widely recognized independent stock market analyst since 1987. He is author of eight investment books, including the best-selling Trading Options for Dummies, rated a TOP Options Book for 2018 by Benzinga.com and now in its third edition, plus The Everything Investing in Your 20s and 30s Book and six other trading books.
The Everything Investing in Your 20s and 30s Book is available at Amazon and Barnes and Noble. It has also been recommended as a Washington Post Color of Money Book of the Month.
To receive Joe’s exclusive stock, option and ETF recommendations, in your mailbox every week visit https://joeduarteinthemoneyoptions.com/secure/order_email.asp.