
In June, we wrote about the bottom in oil and cannabis through USO and MSOS (ETFs) respectively. In July, we wrote about the potential top in NASDAQ and SPY. In August, we wrote about the importance of the retail sector; XRT is below the July calendar range and a major reason the market is yet to make new highs.
All year, we have been on the inflation trade through agriculturals and energy.
Last week, Mish spoke about sugar futures on CNBC Asia and the barometer that it provides traders to gauge inflation. Over the weekend, we wrote about the potential bottom in natural gas.
No inflation you say? That -12% deflationary drag we saw in July CPI, which we saw only as a normal volatile correction in inflation, well that is all gone now.
So, what is next?
The metals seem to be languishing, almost not believing the longer-term impact of what oil and particularly sugar futures have done. Today, we turn our attention to another potential widow maker perhaps ready to resurrect: Gold Miners (GDX).
GDX has been difficult to trade all year. The ETF is a sell when it looks amazing and a buy when it looks horrid.
Top 5 holdings:
Newmont Corporation: 9.95%Barrick Gold Corporation: 9.01%Franco-Nevada Corporation: 8.73%Agnico Eagle Mines Limited: 7.54%Wheaton Precious Metals Corp: 6.11%
Does GDX look horrid enough to consider a buy?
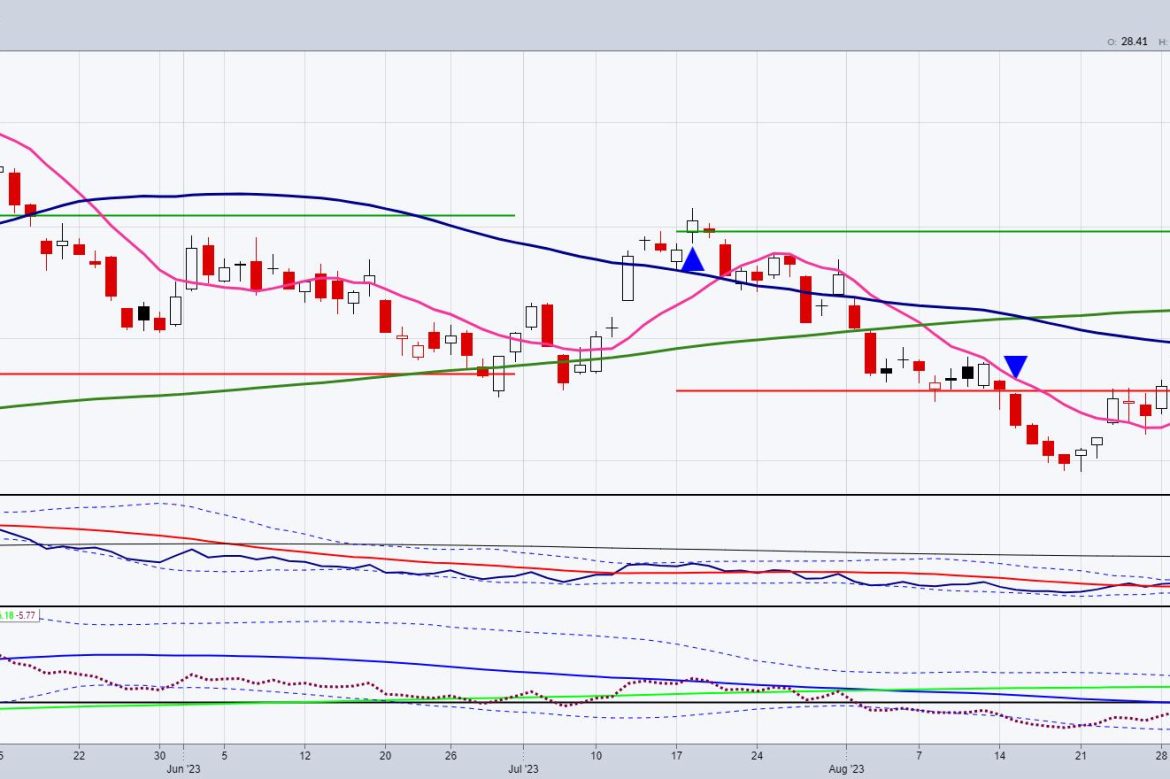
Our Leadership indicator shows GDX is beginning to outperform the SPY. If we are looking for more confirmation, we also want to see the Leadership blue line clear not only the red line, but also the Bollinger Band. Our Real Motion indicator shows a mean reversion in momentum that happened in late to mid-August. However, in a bearish phase along with price, we also want to see the red dotted line cross back over the 50-DMA (blue line).
On price, interestingly, the July 6-month calendar range low and the 10-day moving average align. Recent highs could not clear the overhead 50-DMA, now sitting at around 29.70. With CPI coming on in the morning, this is one ETF that has our attention.
This is for educational purposes only. Trading comes with risk.
For more detailed trading information about our blended models, tools and trader education courses, contact Rob Quinn, our Chief Strategy Consultant, to learn more.
If you find it difficult to execute the MarketGauge strategies or would like to explore how we can do it for you, please email Ben Scheibe at Benny@MGAMLLC.com.
“I grew my money tree and so can you!” – Mish Schneider
Get your copy of Plant Your Money Tree: A Guide to Growing Your Wealth and a special bonus here.
Follow Mish on Twitter @marketminute for stock picks and more. Follow Mish on Instagram (mishschneider) for daily morning videos. To see updated media clips, click here.
Mish in the Media
Mish talks commodities, and how growth could fall while raw materials could run after CPI, in this appearance on BNN Bloomberg.
In this appearance on Fox Business’ Making Money with Charles Payne, Mish and Charles discuss the normalization of rates and the benefit, plus stocks/ETFs to buy.
Mish chats about sugar, geopolitics, social unrest and inflation in this video from CNBC Asia.
Mish talks inflation that could lead to recession on Singapore Breakfast Radio.
“It seems like everybody is cutting back their [oil] production to keep prices higher,” Mish says in this video from CMC Markets. She kicks off her commodities roundup with a look at US oil benchmark West Texas Intermediate (WTI) before moving on to natural gas and gold.
Mish talks her “Worst, Best, and Next” trades in this video from Business First AM.
Coming Up:
September 13: Investing with IBD podcast & Futures Edge podcast with Bob Iaccino; Charting Forward made available on StockCharts TV
September 13-14: Mario Nawfal Twitter Spaces
October 29-31: The Money Show
ETF Summary
S&P 500 (SPY): 440 support, 458 resistance.Russell 2000 (IWM): 185 pivotal.Dow (DIA): 347 pivotal.Nasdaq (QQQ): 363 support, over 375 looks better.Regional Banks (KRE): 44 pivotal.Semiconductors (SMH): 150-161 range to watch.Transportation (IYT): Needs to get back over 247 to look healthier.Biotechnology (IBB): Compression between 124-130.Retail (XRT): 62.90, the July calendar range low, broke down, along with IYT — 2 negative signs.
Mish Schneider
MarketGauge.com
Director of Trading Research and Education