
Week Ahead: NIFTY Forms A Key Support; These Sectors To Outperform
In the previous technical note, the importance of the support level of 19250 was discussed; it was mentioned that if this level stands protected for Nifty, the Index can rebound and inch higher towards 19700+ levels. While trading along these lines, the markets enjoyed trending sessions throughout the week. It had a technical surge and widened its trading range as well. Against the range of 234.90 points seen in the week before this one, NIFTY moved in a larger 434.30 points range and also managed to close near its high point of the range. While continuing to trend all through the past five sessions, the headline index NIFTY closed with a net gain of 384.65 points (+1.98%) on a weekly basis. It may be noted that September has seen the index trading higher by 566.15 points as of now.
The markets are once again within a kissing distance of their all-time high of 19991; the only concerning factor that remains is the volatility. INDIAVIX is once again near its multi-month lows. However, the undercurrent in the markets remains strong. While PSU Banks were relatively outperforming the broader markets, we may also see Private Banks and Financial Services space playing catchup. However, the levels of 19990 remain a strong resistance area. Going by the present technical setup, Nifty has created a trading range between 19500-19990 for itself; this time, any surge beyond this point will result in a meaningful rally.
The coming week will see the levels of 19900 and 20200 acting as potential resistance points going by the options data. The support comes in at 19620 and 19500 levels.
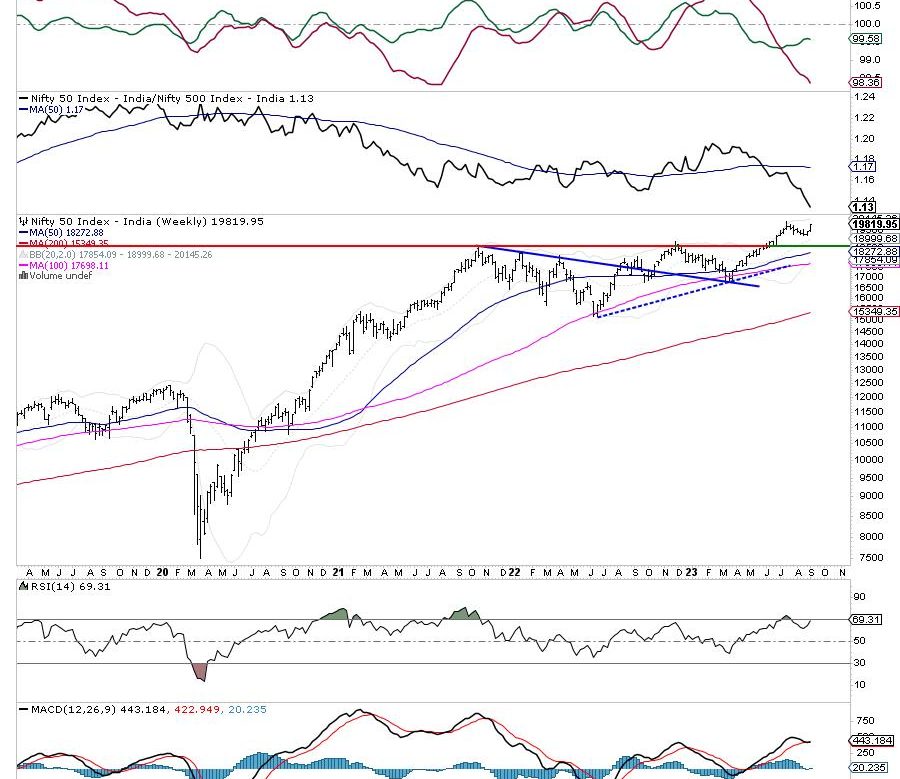
The weekly MACD is in continuing buy mode; it is bullish and trades above the signal line. The widening of the Histogram this time shows an acceleration of momentum on the upside. The weekly RSI is 69.31; it remains neutral and does not show any divergence against the price. A large white candle that emerged shows the strength in the direction of the trend.
The pattern analysis shows an encouraging picture, especially after this week’s move. The pattern analysis of the weekly charts shows that NIFTY achieved a major breakout when it crossed above the previous high that existed near 18900 levels. Following this breakout, the index surged close to 1,000 points following which it suffered a retracement. It gave up over 75% of its breakout journey and was about to suffer a full throwback. However, it has bounced higher forming a higher bottom near 19250. Therefore, so long as 19250 stands protected in the near term, the primary uptrend will stay intact. Only a violation of the 19000-19250 zone will push the markets in an intermediate trend.
All in all, the markets are expected to largely trade with a positive bias; some consolidation though cannot be ruled out. The low point of the previous week, i.e., 19432, rounded off to 19400 should stay protected. We may also see some good sector rotation taking place. We will continue to see PSE, IT, Auto, Consumption, and the banking space making highly stock-specific moves. It is strongly recommended to continue to remain stock-specific in approach and also keep protecting profits at each higher level as VIX continues to remain a concern. Short may be avoided but protection of profits at higher levels is strongly advised over the coming week.
Sector Analysis for the coming week
In our look at Relative Rotation Graphs®, we compared various sectors against CNX500 (NIFTY 500 Index), which represents over 95% of the free float market cap of all the stocks listed.
Relative Rotation Graphs (RRG) analysis does not show any major change in the sectoral setup. Nifty Media, Metal, PSU Bank, Pharma, PSE, Energy, and Midcap 100 Indices are inside the leading quadrant. The Nifty Pharma Index is seen giving up on its relative momentum but overall, these groups are set to outperform the broader NIFTY 500 Index on relative terms.
Nifty Auto and Nifty Realty are inside the weakening quadrant. The infrastructure index is also inside the weakening quadrant but it is seen on the verge of crossing over again inside the leading quadrant.
The Nifty Consumption Index has rolled inside the lagging quadrant. Nifty Bank, Services Sector, Financial Services, and FMCG Indices are also inside the lagging quadrant. These groups are set to relatively underperform the broader markets.
Nifty Commodities and IT indices are inside the improving quadrant and are seen maintaining their relative momentum against the broader markets.
Important Note: RRG™ charts show the relative strength and momentum of a group of stocks. In the above Chart, they show relative performance against NIFTY500 Index (Broader Markets) and should not be used directly as buy or sell signals.
Milan Vaishnav, CMT, MSTA
Consulting Technical Analyst