
Probably the worst or at least one of the worst performers in the overall market and in the commodities market, natural gas is choppy and lifeless. So why write about it?
For starters, we love an underdog. Perhaps a bit too contrarian, as the reasons for the decline in natural gas may reverse quickly.
First off, much of the decline and lack of rally power is credited to cooler U.S forecasts. Secondly, a decline in US electricity output has weakened prices. Thirdly, the rig counts and EIA reports have been mixed.
On the flip side, Australia LNG workers are striking. Enbridge bid $14 billion for Dominion Utilities as the CEO described the assets the company is acquiring as “must-have” infrastructure for providing safe, reliable, and affordable energy. We like to consider all the fundamentals as part and parcel of the technicals.
In other words, regardless of where natural gas goes in the next few weeks, the risk/reward looks tempting, provided there is a sound risk point. No stubborn trading.
Compared to oil prices, natural gas looks cheap. Perhaps for good reasons, but, nonetheless, let’s examine the charts.
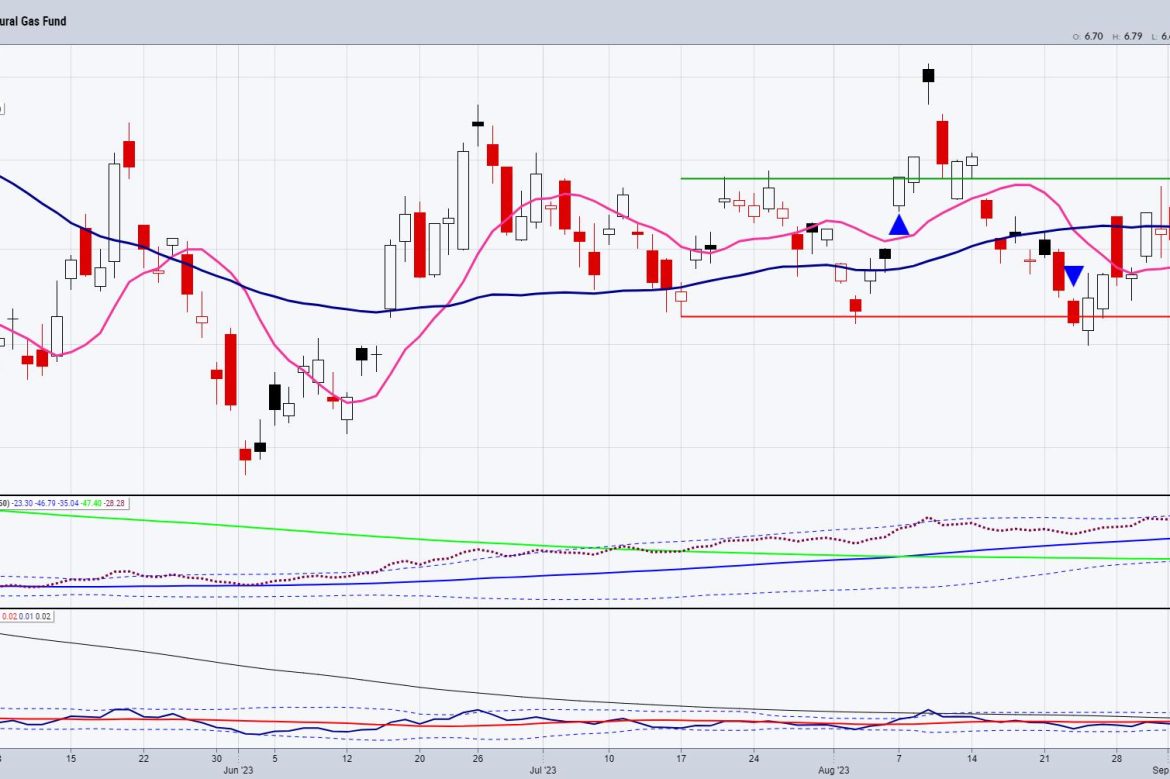
The first chart is of the ETF UNG. The top holding is the U.S. Dollar at 61.14%, which means that the ETF is heavy into cash. This is similar to what we saw in MSOS, the Cannabis ETF, back on June 21st when we wrote an article called “Is Cannabis Finally Low Enough to Go High?”
On dollar holdings, our research found if an ETF allocates a significant portion of its assets to holdings denominated in US dollars, it could be a defensive position during uncertain market conditions. Cash holdings can act as a buffer against market volatility or as a safe haven asset. Since MSOS is up over 30% since that article, we wonder, could UNG and its dollar holdings lessen over time?
The UNG chart leads us to make a few assumptions.
There must be a high short float.The price is hanging onto the July 6-month calendar range low (red horizontal lone).Our Real Motion indicator shows a BULLISH divergence, with the momentum above the 50 daily moving average (blue) and in a bullish phase.Our Leadership indicator shows UNG underperforming, but, this past week, the performance gained a bit.Risk/reward is potentially stellar, although with bottom picking, one must be aware of the risks.
The futures chart is of the October 2023 contract. There is a floor of support at $2.00. In September 2020, the last low, before the huge explosion higher, was at $1.795. A move over $3.00 looks more enticing.
This is for educational purposes only. Trading futures and ETFs comes with risk.
For more detailed trading information about our blended models, tools and trader education courses, contact Rob Quinn, our Chief Strategy Consultant, to learn more.
If you find it difficult to execute the MarketGauge strategies or would like to explore how we can do it for you, please email Ben Scheibe at Benny@MGAMLLC.com.
“I grew my money tree and so can you!” – Mish Schneider
Get your copy of Plant Your Money Tree: A Guide to Growing Your Wealth and a special bonus here.
Follow Mish on Twitter @marketminute for stock picks and more. Follow Mish on Instagram (mishschneider) for daily morning videos. To see updated media clips, click here.
Mish in the Media
Mish chats about sugar, geopolitics, social unrest and inflation in this video from CNBC Asia.
Mish talks inflation that could lead to recession on Singapore Breakfast Radio.
“It seems like everybody is cutting back their [oil] production to keep prices higher,” Mish says in this video from CMC Markets. She kicks off her commodities roundup with a look at US oil benchmark West Texas Intermediate (WTI) before moving on to natural gas and gold.
Mish talks her “Worst, Best, and Next” trades in this video from Business First AM.
Mish explains why she’s cheerful about the markets in this August 29th appearance on Business First AM.
Mish and Chuck discuss the small caps and why they could rally from here on Money Life with Chuck Jaffe.
Mish served as guest host for the Monday, August 28 edition of StockCharts TV’s The Final Bar! Mish puts her own spin on the Market Recap, starting with the indices and then exploring sectors using her “Economic Modern Family” analysis. She then sits down with Keith Schneider for an insightful interview. Keith discusses topics such as agricultural commodities, biotechnology, and volatility.
Mish and Charles discuss a secular bear market in bonds and why gold could outshine expectations in this appearance on Fox Business’ Making Money with Charles Payne.
Mish and Paul Gruenwald discuss soft landings, recession, inflation, GDP and China on Yahoo Finance.
Mish looks at a selection of popular instruments and outlines their possible direction of travel in this appearance on CMC Markets.
Mish talks NVDA and “Trading the Weather” in these two appearances on Business First AM.
Coming Up:
September 12: BNN Bloomberg & Charting Forward, StockCharts TV
September 13: Investing with IBD podcast
October 29-31: The Money Show
ETF Summary
S&P 500 (SPY): 440 support, 458 resistance.Russell 2000 (IWM): 185 pivotal.Dow (DIA): 347 pivotal.Nasdaq (QQQ): 363 support and over 375 looks better.Regional Banks (KRE): Another modern family member struggling here under 44.Semiconductors (SMH): 150-161 range to watch.Transportation (IYT): Broke the calendar range low along with XRT; not so healthy.Biotechnology (IBB): Compression between 124-130.Retail (XRT): 62.90, the July calendar range low, broke down, along with IYT-2 negative signs.
Mish Schneider
MarketGauge.com
Director of Trading Research and Education