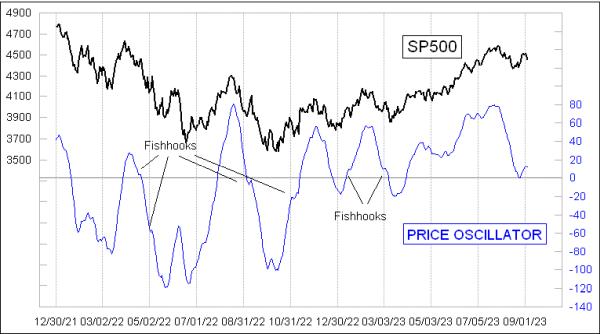
There are fishhook structures forming in several indicators, and here is why we should be getting excited about that.
A fishhook structure forms in a Price Oscillator or Summation Index chart when there is a brief reversal of trend that does not persist. It can happen in either direction, and this week’s lead chart of the McClellan Price Oscillator for the S&P 500 shows several examples of it happening in both directions. A fishhook says that the effort to reverse course has failed, and that opens the door for a more energetic resumption of the prior trend, whose proponents are now rested and ready to go to work.
One reason we get excited about fishhooks is that they have the potential for a lot of energy on that resumption of the prior trend. It does not always play out that way, but the potential is there. The granddaddy of all fishhooks occurred in early October 1987:
That fishhook arose when a countertrend rally attempt occurred in late September 1987, following the August 25, 1987 price top. The countertrend rally failed, and that opened the door for the bears to resume their decline. The bears had some help in that instance from a brand new Fed chairman named Alan Greenspan, who wanted to let everyone know he was the big new dog in town. He had taken office just 2 weeks before the price top, and he implemented a hike in the Discount Rate on September 4, 1987, just to “mark his territory”.
You may notice in that chart from 1987-88 that there were other fishhooks back then which did not lead to calamity, and most don’t bring us a crash like October 1987. But the potential for a strong trend resumption is there.
The S&P 500 right now is not the only index showing us a fishhook in its Price Oscillator. We see them also in the Price Oscillators of the DJIA and the Nasdaq Composite Index, shown below.
I want to point out a couple of things in that chart of the Nasdaq’s Price Oscillator. Back in early October 2022, there was a fishhook structure which formed when the Price Oscillator was already at a pretty low level. While that did lead to a slightly lower low, it did not bring huge calamity, in part because that market was already pretty stretched and so it is hard to get a lot more downward energy going when you are fighting against the taut bungee cords.In late April 2023, there was a small fishhook structure which also did not bring a big decline. Instead, it resolved with prices turning higher, and turning the Price Oscillator back up again. That is always a possibility. A fishhook structure just represents the potential for a powerful trend resumption, and is no guarantee that we will see one.
You can see additional rules for interpreting fishhook structures in this article.

