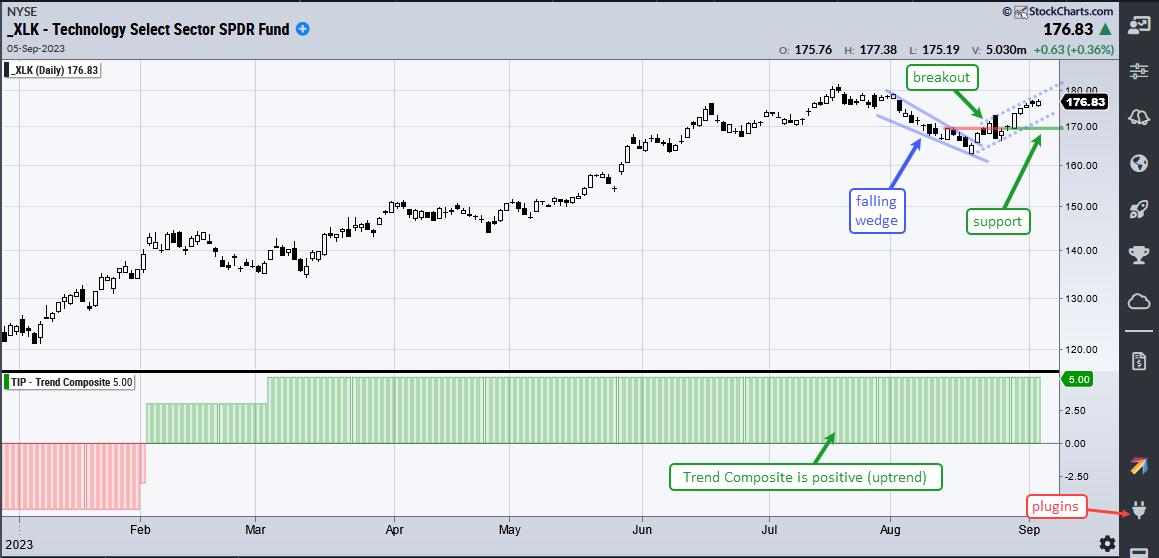
Stocks surged in the second half of August with several ETFs breaking out of corrective patterns, such as falling flags or falling wedges. Even though September is a seasonally weak month, these breakouts are bullish until proven otherwise. Today’s commentary will analyze the breakout in the Technology SPDR (XLK).
The Key to the Breakout in XLK
The chart below shows XLK in a long-term uptrend. The Trend Composite turned positive in early February and is currently at +5. This means all five inputs are on bullish signals (Bollinger Bands, CCI, StochClose, Keltner, SMA Direction). The Trend Composite is part of the TIP indicator edge plugin for StockCharts ACP. Click here to learn more.
XLK hit a 52-week high in July and then corrected into mid August with a falling wedge. As discussed at TrendInvestorPro, this pattern is typical for pullbacks within bigger uptrends. XLK broke out of this wedge on August 23rd and then surged 2% on August 29th with a long white Marubozu candlestick. These candlesticks reflect a strong advance from open to close because they have no tails.
This candlestick holds the key to the August breakout and immediate uptrend. A strong advance and breakout should hold. A close below 169 would negate the August 29th surge and the August breakout. The blue dashed lines show the alternative pattern at work (a rising flag). A break below 169 would confirm the rising flag and signal a continuation of the prior decline (mid July to mid August).
Check out the Chart Trader report at TrendInvestorPro for more on these breakouts. Tuesday’s report covered the breakouts in SPY and QQQ, seasonal patterns for the next three months and several trading setups. Symbols include XLV, IBB, JETS, IHI, AMD, AZN, CSX, ORLY and PAYX. Last week we covered the breakouts in gold, several tech-related ETFs and stocks. Click here for immediate access.
—————————————

