
On July 5th, Mish wrote an article called “Sell in July and Go Away? Calendar Range Reset”.
In that article, she noted, “should IWM fail to clear the calendar range high and worse, break down under a new 6-month calendar range low[…] it would be hard to think NASDAQ can sustain current levels.”
July 19th so far, marks the top of the market.
Yesterday, we featured the retail sector through the ETF XRT. This sector represents the major shopping habits of Americans, or 68% of the GDP. One could argue that, despite the headwinds, the consumer is holding up.
One could also argue that, while true, for how long can that really go on?
In asking those questions, we also examined the charts. Our conclusion? XRT, while significantly underperforming the benchmark, has yet to convincingly break down, or breakout for that matter.
The small-caps through the ETF IWM are performing better than XRT. However, while IWM is well below the July 6-month calendar range high, it remains well above the calendar range low at 180.72. In other words, we are still in correction mode rather than bear market mode.
Retail can sour the markets more, of course. And growth, which has outperformed value, exemplifies the weaker retail sector, yet stronger tech sector. Nonetheless, today we turn our attention to Nasdaq to see if this has indeed seen the best of the rally and is poised for lower levels.
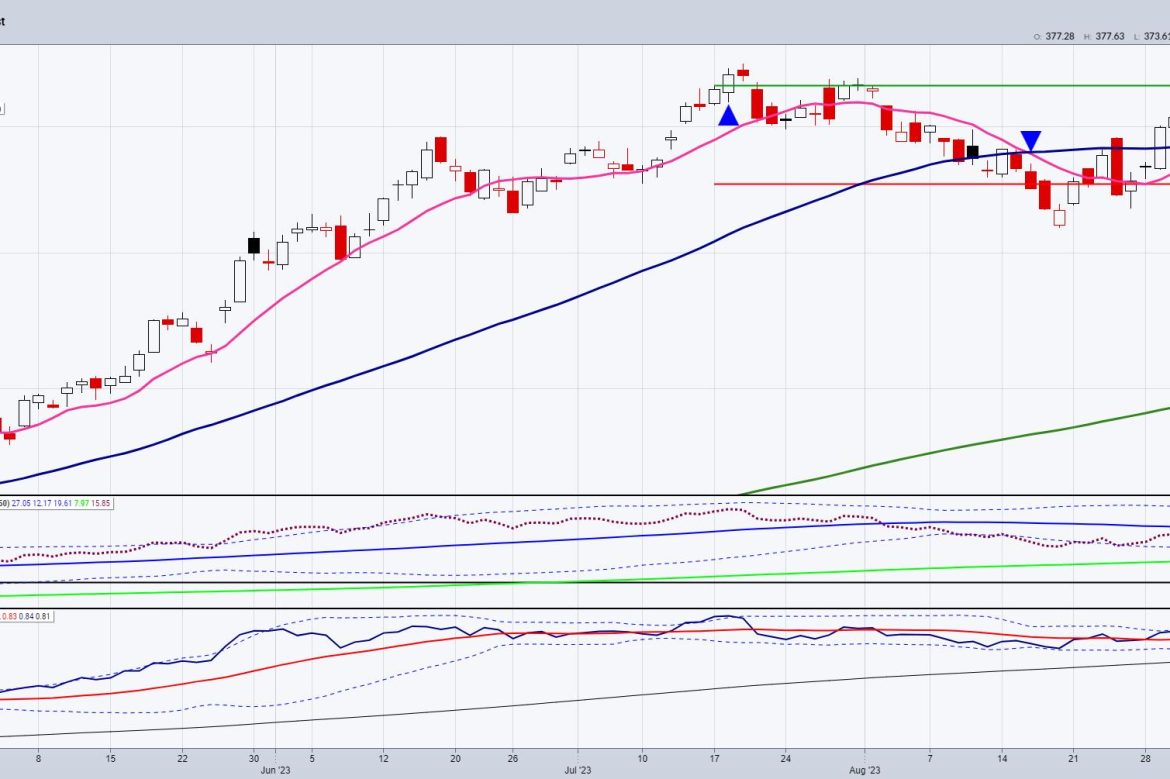
With Tesla, Nvidia and Apple all down between 2-4% in today’s session, QQQs are approaching a huge support area. The QQQ chart right now has a few key aspects based on our MarketGauge proprietary indicators.
The Phase: Bullish, as the 50-DMA (blue) is above the 200-DMA (green) while the price trades above both MAs.Fast MA: With today’s action, QQQs are holding the MA (pink). Interesting that the fast MA is in alignment with the 50-DMA.Calendar Ranges: QQQ could not clear above the July 6-month calendar range high (horizontal green line). However, it is well above the July 6-month calendar range low (red line). Real Motion: QQQs momentum is weakening and shows a bearish divergence sitting under the 50-DMA, while price remains above its 50-DMA Leadership: QQQ has outperformed the SPY since late August, although it is failing the dotted Bollinger Band.
Put this all together and we have solid reasons why growth is supreme over value. We also have some palpable resistance at the July 6-month calendar range highs that, until it clears, means with the weaker momentum, there is the possibility QQQs could test the July calendar range low.
The best we can say now is this is a technical correction.
It certainly could turn into more downside, especially if the retail and small caps fall much further. Likewise, if this is merely a correction, then we ought to see a better bounce from current levels very soon. But, until either scenario plays out, QQQs are rangebound.
For more detailed trading information about our blended models, tools and trader education courses, contact Rob Quinn, our Chief Strategy Consultant, to learn more.
If you find it difficult to execute the MarketGauge strategies or would like to explore how we can do it for you, please email Ben Scheibe at Benny@MGAMLLC.com.
“I grew my money tree and so can you!” – Mish Schneider
Get your copy of Plant Your Money Tree: A Guide to Growing Your Wealth and a special bonus here.
Follow Mish on Twitter @marketminute for stock picks and more. Follow Mish on Instagram (mishschneider) for daily morning videos. To see updated media clips, click here.
Mish in the Media
“It seems like everybody is cutting back their [oil] production to keep prices higher,” Mish says in this video from CMC Markets. She kicks off her commodities roundup with a look at US oil benchmark West Texas Intermediate (WTI) before moving on to natural gas and gold.
Mish talks her “Worst, Best, and Next” trades in this video from Business First AM.
Mish explains why she’s cheerful about the markets in this August 29th appearance on Business First AM.
Mish and Chuck discuss the small caps and why they could rally from here on Money Life with Chuck Jaffe.
Mish served as guest host for the Monday, August 28 edition of StockCharts TV’s The Final Bar! Mish puts her own spin on the Market Recap, starting with the indices and then exploring sectors using her “Economic Modern Family” analysis. She then sits down with Keith Schneider for an insightful interview. Keith discusses topics such as agricultural commodities, biotechnology, and volatility.
Mish and Charles discuss a secular bear market in bonds and why gold could outshine expectations in this appearance on Fox Business’ Making Money with Charles Payne.
Mish and Paul Gruenwald discuss soft landings, recession, inflation, GDP and China on Yahoo Finance.
Mish looks at a selection of popular instruments and outlines their possible direction of travel in this appearance on CMC Markets.
Mish talks NVDA and “Trading the Weather” in these two appearances on Business First AM.
Coming Up:
September 7: Singapore Breakfast Radio, 89.3 FM & Wolf Financial Twitter Spaces & CNBC Asia
September 12: BNN Bloomberg & Charting Forward, StockCharts TV
September 13: Investing with IBD podcast
October 29-31: The Money Show
ETF Summary
S&P 500 (SPY): 440 support, 458 resistance.Russell 2000 (IWM): 185 pivotal, 190 has to clear.Dow (DIA): 347 pivotal.Nasdaq (QQQ): 363 support, over 375 looks better.Regional banks (KRE): Another modern family member struggling here under 44.Semiconductors (SMH): 150-161 range to watch.Transportation (IYT): Broke the calendar range low along with XRT; not so healthy.Biotechnology (IBB): Compression between 124-130.Retail (XRT): 62.90 the July calendar range low broke down, along with IYT — 2 negative signs.
Mish Schneider
MarketGauge.com
Director of Trading Research and Education