
This entire year, retail, as measured by the ETF XRT (a.k.a. the Granny of the Economic Modern Family), has underperformed the SPY and QQQs. Encumbered by higher interest rates, higher oil prices, higher inflation, higher insurance costs, and a burgeoning credit card debt, we have wondered many times this year if Granny can keep up. Yet, each time we think Granny, or the consumer, is done, buying has come in to save that sector from becoming a longer-lasting ball and chain.
Examining the ETF, the top sector with 92.52% of the holdings is in Retail Trade. Consumer services, non-durables, and distribution services have a much smaller weight. Really interesting is that Carvana is now the top stock, holding at 3.49%, with:
Abercrombie & Fitch Co. Class A: 2.07%American Eagle Outfitters, Inc.: 1.89%Hibbett Inc.: 1.68%Boot Barn Holdings, Inc.: 1.67%Signet Jewelers Limited: 1.66%Ollie’s Bargain Outlet Holdings Inc.: 1.64%Lithia Motors, Inc.: 1.60%Kohl’s Corporation: 1.60%Gap, Inc.: 1.59%
The top 10. XRT also holds Ulta, Target, Kroger, Etsy, Nordstrom, GameStop and Walmart.
That puts the major thrust of the sector into staples with some consumer discretionary exposure. We like that, as it represents the major shopping habits of Americans, or 68% of the GDP.
One could argue that, despite the headwinds, the consumer is holding up. And one could also argue that while true, how long can really that go on?
The definition of recession is 2 quarters of declining GDP. Although we had that in the spring 2022, the US quickly came out of it by fall 2022. Currently, our GDP is 2.39.
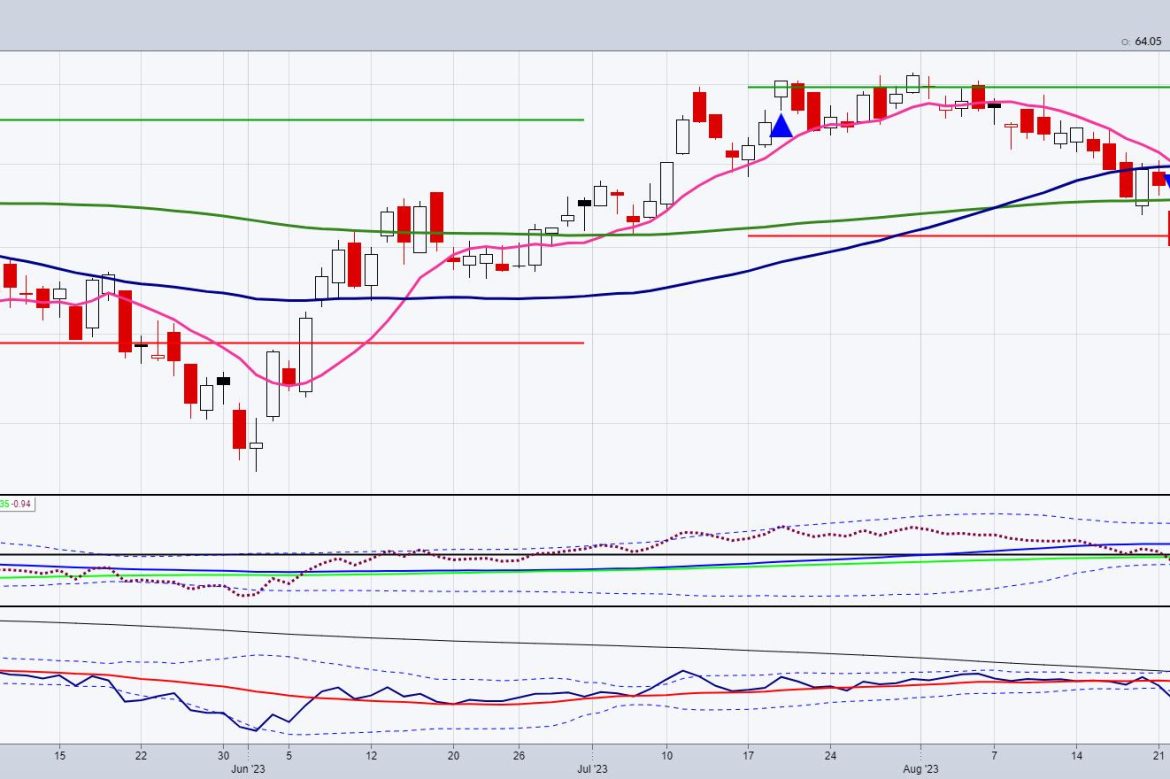
What is great about chart reading is that we can gauge the GDP based on XRT’s performance ahead of the quarterly (and often revised) numbers the government releases. The XRT chart right now has a few key aspects based on our MarketGauge proprietary indicators.
The Phase: With the return under the 200-DMA (green) while the 50 DMA is above (blue), the phase is distribution. Fast MA: With today’s action, XRT is holding the 10-DMA (pink).Calendar Ranges: XRT could not clear above the July 76-month calendar range high (horizontal green line). However, it is holding the July 6-month calendar range low (red line). Real Motion: XRT’s momentum is weakening after the mean reversion buy signal at the end of August. Leadership: XRT has underperformed the SPY since early August and continues to weaken against the benchmark.
Put this all together and we have some key areas holding that need to continue to hold. We also have some palpable resistance that, until it clears, means we cannot expect to see a lot of growth in the economy as measured by the consumer.
Should XRT break the July calendar range low, we will once again be talking about the 80-month moving average or the 6-/7-year business cycle low. For now, we are cautious and thinking that the damage from the rapid acceleration of rates and that that acceleration of rates did not help food or energy costs go down, so recession is still very much on the table.
For more detailed trading information about our blended models, tools and trader education courses, contact Rob Quinn, our Chief Strategy Consultant, to learn more.
If you find it difficult to execute the MarketGauge strategies or would like to explore how we can do it for you, please email Ben Scheibe at Benny@MGAMLLC.com.
“I grew my money tree and so can you!” – Mish Schneider
Get your copy of Plant Your Money Tree: A Guide to Growing Your Wealth and a special bonus here.
Follow Mish on Twitter @marketminute for stock picks and more. Follow Mish on Instagram (mishschneider) for daily morning videos. To see updated media clips, click here.
Mish in the Media
Mish explains why she’s cheerful about the markets in this August 29th appearance on Business First AM.
Mish and Chuck discuss the small caps and why they could rally from here on Money Life with Chuck Jaffe.
Mish served as guest host for the Monday, August 28 edition of StockCharts TV’s The Final Bar! Mish puts her own spin on the Market Recap, starting with the indices and then exploring sectors using her “Economic Modern Family” analysis. She then sits down with Keith Schneider for an insightful interview. Keith discusses topics such as agricultural commodities, biotechnology, and volatility.
Mish and Charles discuss a secular bear market in bonds and why gold could outshine expectations in this appearance on Fox Business’ Making Money with Charles Payne.
Mish and Paul Gruenwald discuss soft landings, recession, inflation, GDP and China on Yahoo Finance.
Mish looks at a selection of popular instruments and outlines their possible direction of travel in this appearance on CMC Markets.
Mish talks NVDA and “Trading the Weather” in these two appearances on Business First AM.
Coming Up:
September 6: Mario Nawfal, Twitter Spaces
September 7: Singapore Breakfast Radio, 89.3 FM & Wolf Financial Twitter Spaces & CNBC Asia
September 12: BNN Bloomberg & Charting Forward, StockCharts TV
September 13: Investing with IBD podcast
October 29-31: The Money Show
ETF Summary
S&P 500 (SPY): 440 support 458 resistanceRussell 2000 (IWM): 185 pivotal 190 has to clearDow (DIA): 347 now pivotal supportNasdaq (QQQ): 363 support and over 375 looks goodRegional Banks (KRE): Needs to hold 44 to be convincingSemiconductors (SMH): 150-161 range to watchTransportation (IYT): 252 biggest overhead resistanceBiotechnology (IBB): Compression between 124-130Retail (XRT): 62.90-key support to hold
Mish Schneider
MarketGauge.com
Director of Trading Research and Education