
Week Ahead: Important For Nifty To Say Above This Level; Expect Outperformance In These Pockets
The past five sessions of the week saw the Indian equities trading in a defined and narrower range. The first four sessions were seen leading the markets to a weekly loss but the strong trending session on Friday saw Nifty recouping its losses. As compared to the previous week, the index oscillated in a narrower 234.90 points range. The price action over the past five sessions has led to the formation of a bar with a similar bottom and lower high for the index. Following a strong rebound in the previous session, the headline index closed with a net gain of 169.50 points (+0.88%) on a weekly basis.
There is one important change that is happening; beginning next week, Banknifty’s weekly options expiry is being moved to Wednesday. Until now, both Nifty and Banknifty weekly options expired every Thursday; but from now on, Banknifty Options will expire/settle every Wednesday and Nifty on Thursday.
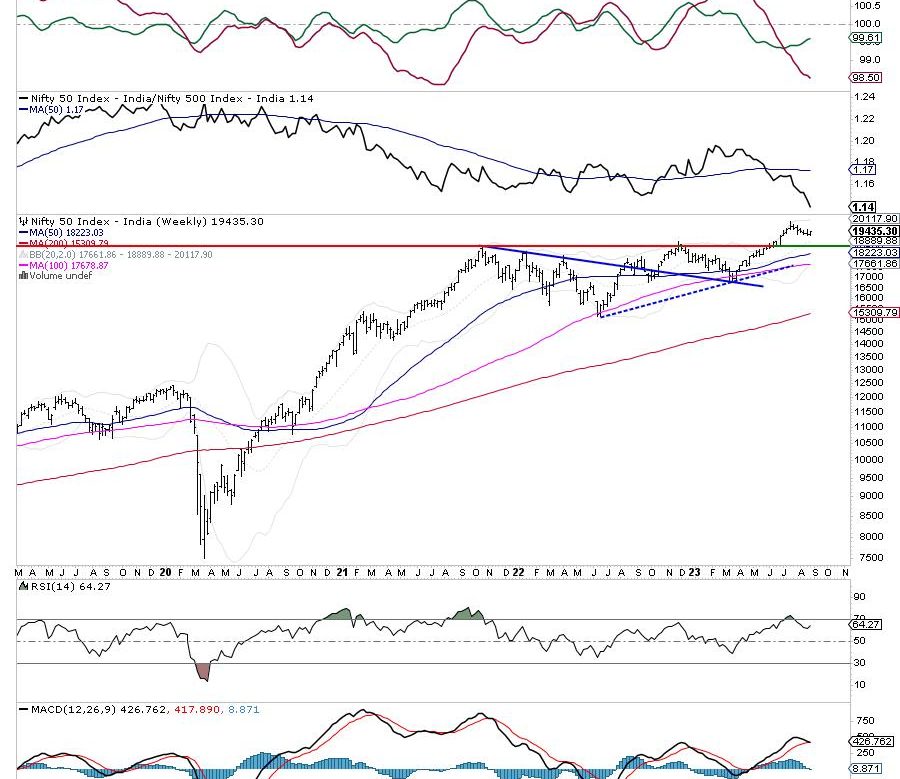
The Nifty 50 had been lingering around the 19,250 mark until a recent rebound that occurred on Friday. The significance of this support level cannot be overstated in the days ahead. It is absolutely essential for the Nifty’s ongoing upward trajectory to sustain a weekly closing above 19,250. Should it dip below this threshold, it may indicate additional vulnerability, possibly resulting in a test of the 18,800 support level. It is advisable to closely monitor the Nifty’s weekly closing figures, with a specific focus on the 19,250 level. If there is a consistent breach below this threshold, it may signify a change in market sentiment and the possibility of additional declines. On the other hand, a resurgence from this level could rekindle bullish momentum.
Volatility dropped over the past week; INDIAVIX came off by 5.94% to 11.36 on a weekly basis. The coming week is expected to see the levels of 19600 and 19730 acting as resistance levels. The supports come in at 19250 and 19000 levels.
The weekly RSI is 64.27; it remains neutral and does not show any divergence against the price. The weekly MACD is bullish; however, it sits on the verge of a negative crossover as evidenced by the sharply narrowing Histogram.
The pattern analysis shows that the breakout that NIFTY staged following its move above 18900-19000 levels stays valid despite the recent corrective retracement. However, if the level of 19250 is violated, it may lead to Nifty retesting the breakout point again leading to a full throwback.
In the previous technical note, it was mentioned that defensive pockets like IT, and low beta space like PSE stocks may do well. The previous week did see these pockets doing well and this trend is likely to get carried forward over the coming week as well. The markets are having their primary uptrend intact; however, at present, they remain under a secondary corrective phase. This may lead to oscillations on either side. It is recommended to avoid excessive exposures and remain light on leveraged exposures while maintaining a selective and stock-specific outlook for the coming week.
Sector Analysis for the coming week
In our look at Relative Rotation Graphs®, we compared various sectors against CNX500 (NIFTY 500 Index), which represents over 95% of the free float market cap of all the stocks listed.
Relative Rotation Graphs (RRG) analysis shows Nifty PSE Index has rolled inside the leading quadrant. Besides this, the Media, Metal, PSU Bank, Pharma, Energy, and Midcap indices are also inside the leading quadrant. These groups may show relative outperformance against the broader markets.
The Nifty Infrastructure index has rolled inside the weakening quadrant. Nifty Realty, Auto, and Consumption indices are also inside the weakening quadrant.
Nifty FMCG, Financial Services, Banknifty, and Services Sector index languish inside the lagging quadrant. This may lead to these groups relatively underperforming the broader NIFTY 500 index.
The Nifty commodities index, which is inside the improving quadrant is seen improving on its relative momentum again. The IT Index also remains firmly placed inside the improving quadrant.
Important Note: RRG™ charts show the relative strength and momentum of a group of stocks. In the above Chart, they show relative performance against NIFTY500 Index (Broader Markets) and should not be used directly as buy or sell signals.
Milan Vaishnav, CMT, MSTA
Consulting Technical Analyst