
Stocks were hit hard in August with QQQ leading the way lower and breaking its July low. Stocks that did not break their July lows are holding up better and showing relative strength. These are the stocks I want on my WatchList for tradable pullbacks and short-term breakouts. AMAT is one such stock.
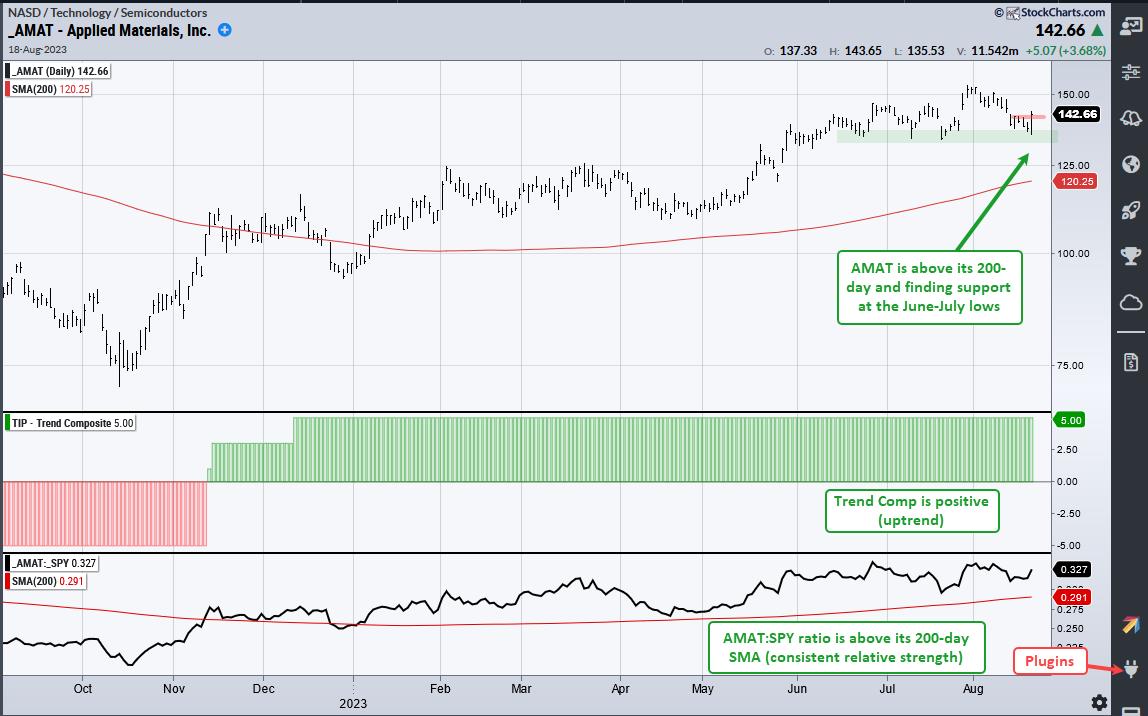
The chart shows Applied Materials in a long-term uptrend, which is the first prerequisite for trading. AMAT is above the rising 200-day SMA and the stock hit a 52-week high in late July. The first indicator window confirms the uptrend because the Trend Composite is positive. Note that this indicator is part of the TIP Indicator Edge Plugin for StockCharts ACP.
The bottom window shows AMAT performance relative to the S&P 500 SPDR (SPY). This indicator is also above its rising 200-day and this means AMAT shows long-term relative strength. This is the second prerequisite. Short-term pullbacks represent opportunities when the long-term trend is up and a stock shows relative strength. Notice that AMAT pulled back to the support zone from the June-July lows and surged on Friday. This bounce broke short-term resistance and reversed the downswing.
TrendInvestorPro runs momentum rotation strategies that trade Nasdaq 100 and S&P 500 stocks. These are quantified strategies with signals published every weekend. AMAT is currently in the model portfolio for the Nasdaq 100 Rotation Strategy. We also run a mean-reversion strategy that trades stocks in the Russell 1000. Click here to lean more and gain immediate access.
The ATR Trailing Stop, Trend Composite, Momentum Composite and eight other indicators are part of the TrendInvestorPro Indicator Edge Plugin for StockCharts ACP. Click here to take your analysis process to the next level.
—————————————