
Every week that goes by seems to show how the mega-cap stocks that pushed the market higher in the first seven months of the year have now taken a back seat. Sectors like Financials and Energy have seen improved relative strength, while previous bellwether groups like semiconductors have begun to underperform.
When I noted bearish momentum divergences on key growth names last month, I began to think through a scenario called “The Great Rotation of 2023”. The general line of thinking was that, if and when growth stocks decided to take a breather, those assets would rotate elsewhere. Would it be to cyclical sectors like Energy, or more defensive sectors like Utilities?
As the Nasdaq 100 closed below its 50-day moving average this week, following similar breaks of support from stocks like Microsoft (MSFT) and Apple (AAPL), it seems that market has answered in a clear voice that it’s sectors like Energy which are now taking a new leadership role in August 2023.
Let’s review the technical setup that led to this great rotation, how to visualize the leadership roles shifting between sectors, and identify some ETFs that may have further opportunities to outperform in the coming weeks and months.
The Benchmarks Break Down
Stocks like Microsoft and Apple made consistently higher highs pretty much every month in 2023. But after making new highs in mid-July, both stocks have now pushed lower and now have violated the 50-day moving average.
AAPL has demonstrated perhaps the clearest evidence of a stock in a distribution phase, with a gap below the 50-day moving average followed immediately by further downside movement. This suggests that no willing buyers came in to buy on price weakness, but instead that more selling pressure is in play.
The Nasdaq 100 is now about 6% off its July high, while leading names like AAPL and MSFT are down 11% and 13%, respectively. I was taught that “all large losses begin as small losses,” and, given the initial downthrust in these leading names, I’m inclined to stay out of the way until some sort of support level is established.
With the top-heavy nature of our equity indexes, with even the S&P 500 weighted heavily to these mega-cap growth stocks, the S&P is also under pressure.
The SPX did manage to hold its 50-day moving average this week, but it’s worth noting that only 55% of S&P 500 members are above their own 50-day moving average. That’s down from about 90% just three weeks ago! To rephrase, about a third of the S&P 500 members have broken their 50-day moving average in the last couple weeks.
Visualizing the Rotation from Growth to Value
The weekly RRG chart provides an ideal way to visualize sector rotation, so a review of the RRG seemed to be a logical next step for me to quantify a potential rotation from growth to value.
Back in March, the RRG was very much in a growth-over-value position. Growth sectors like Technology and Communication Services were firmly in the Leading Quadrant, while value-oriented sectors like Financials and Energy were pushing into the Lagging Quadrant.
Growth sectors dominated the first six months of 2023, and even into June you could still see the strong outperformance of the FAANG sectors. But all of a sudden, forgotten sectors like Financials and Energy started to improve. Relative strength readings began to stabilize as most sectors saw improving price action.
Now in August, the drop in growth stocks has created a very different appearance to the RRG chart.
Note how the XLC and XLK are now in the Weakening Quadrant, showing a decline in relative strength momentum after the recent pullback. The Improving Quadrant includes sectors like Industrials, Financials, Energy, and Materials, all of which have seen a definitive improvement in relative strength.
The Great Rotation of 2023 appears to be less about a rotation from offense to defense, and more about a rotation from growth sectors to cyclical sectors like Energy. So which ETFs have improved to the point where they deserve a second look for investors?
Two ETFs Making New Relative Highs
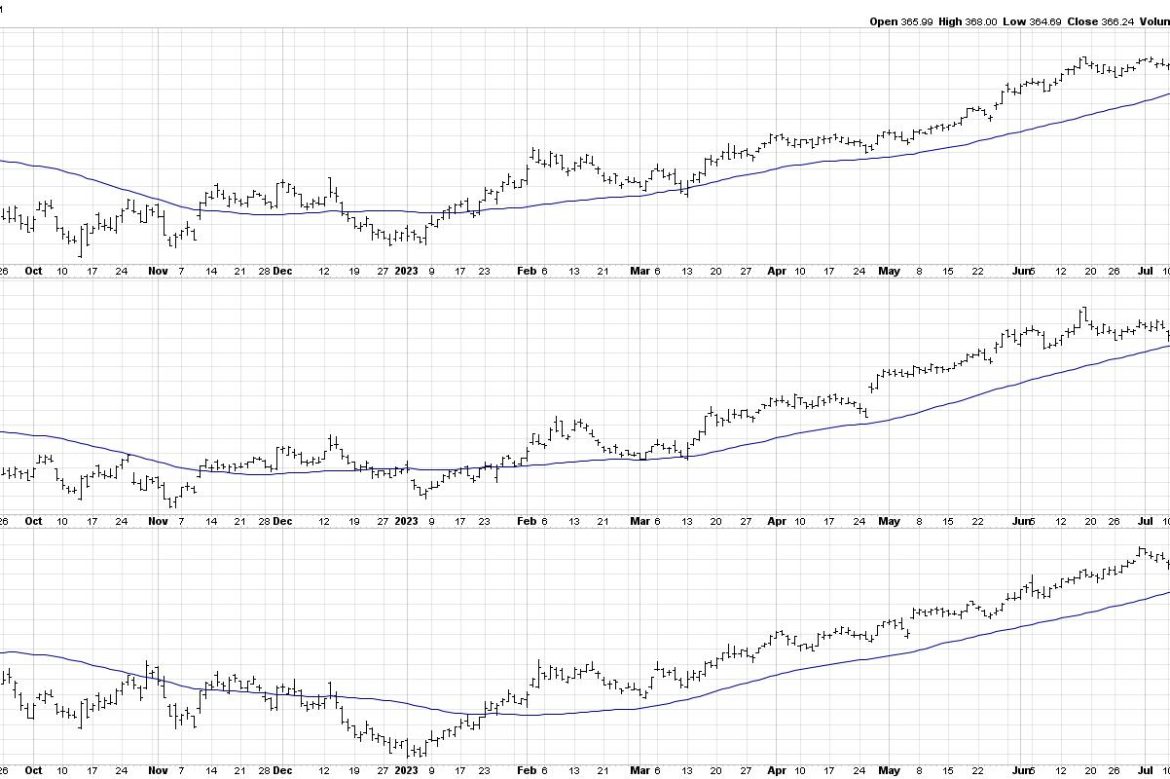
I often scan for stocks and ETFs making new swing highs for my Market Misbehavior Premium Members. The S&P SPDR Oil & Gas Exploration and Production ETF (XOP) surfaced recently as an example of a previously underperforming industry group that has rotated higher.
The second panel down shows the relative strength of the XOP as well as the Oil Services ETF (OIH) relative to the S&P 500. Note the downtrend in relative strength through the end of April, then the sideways relative performance in June and early July, and then a period of outperformance from mid-July through mid-August.
Now check out the bottom panel to see how two technology ETFs–IYW and SMH–have performed during this same period. Just as the RRG showed a clear rotation away from growth and into value, this chart shows the Great Rotation from sectors like Technology to new leadership including Energy.
We can speculate about when and how this Great Rotation will end, and when growth sectors will once again step into a leadership role. I’d much rather wait patiently for the charts to indicate that conditions have changed once again. For now, the charts are telling me to focus on emerging leadership in cyclical sectors until proven otherwise!
RR#6,
Dave
P.S. Ready to upgrade your investment process? Check out my free behavioral investing course!
David Keller, CMT
Chief Market Strategist
StockCharts.com
Disclaimer: This blog is for educational purposes only and should not be construed as financial advice. The ideas and strategies should never be used without first assessing your own personal and financial situation, or without consulting a financial professional.
The author does not have a position in mentioned securities at the time of publication. Any opinions expressed herein are solely those of the author and do not in any way represent the views or opinions of any other person or entity.