
Many, in fact most, retail investors that were surveyed believe that the bonds have bottomed. Bill Ackman came out last week extremely bearish.
Here’s the technical skinny. Last week, TLT had a classic reversal bottom on very oversold conditions. Although TLT still underperforms SPY (risk on) according to the Leadership indicator, TLT did gain traction.
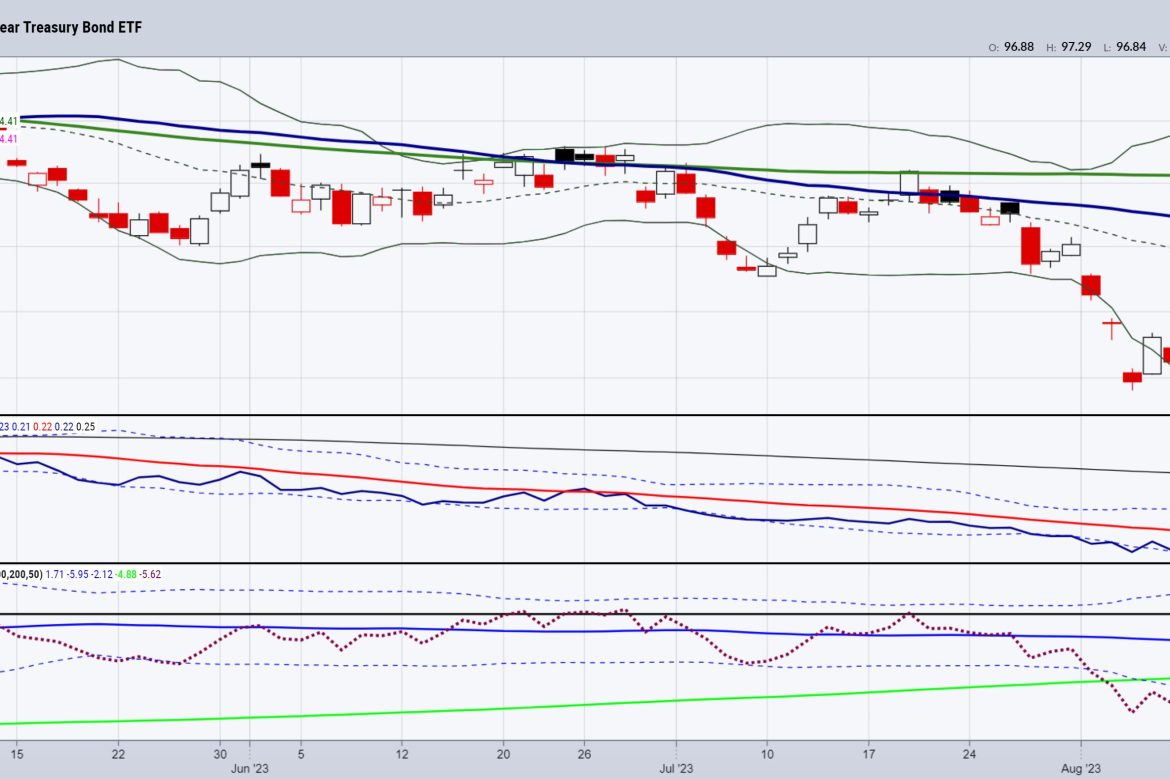
On the Real Motion indicator, TLT is having a mean reversion, meaning that the red dots are crossing back over the Bollinger Band. Price has come back from the lows, true. However, the gap that was left on August 2nd has yet to be filled. 97.90 fills that gap and, thus far on this move, TLT has risen to 97.37.
Perhaps the most interesting is that since the gap lower, TLT has failed to clear 97.24-97.37. Is that, then, a triple top or just a point of resistance which will, at some point, clear?
On the weekly chart (not shown), TLT is having an inside week, meaning the trading range thus far is still inside the range of last week.
Finally, as we have been examining the July 6-month calendar ranges, TLT is far below the July calendar range low. During the January range, TLT never cleared the January calendar range high. Furthermore, TLT never really broke below the January calendar range low. That is quite a different story from the present.
Many fundamental analysts believe that when/if bonds rally, especially if they start to outperform the SPY, a recession is nigh. Others believe that the FED will stay higher for longer and yields may flatten, and possibly go higher, not lower. Regardless, to think bottom, we need to see the momentum improve, the gap filled, and SPY fall further from here. Otherwise, this is a technical bounce after a splendid sell-off, and nothing more.
For more detailed trading information about our blended models, tools and trader education courses, contact Rob Quinn, our Chief Strategy Consultant, to learn more.
If you find it difficult to execute the MarketGauge strategies or would like to explore how we can do it for you, please email Ben Scheibe at Benny@MGAMLLC.com.
“I grew my money tree and so can you!” – Mish Schneider
Get your copy of Plant Your Money Tree: A Guide to Growing Your Wealth and a special bonus here.
Follow Mish on Twitter @marketminute for stock picks and more. Follow Mish on Instagram (mishschneider) for daily morning videos. To see updated media clips, click here.
Mish in the Media
Mish covers why August is a good time for caution in this appearance on Business First AM.
Ahead of Thursday’s critical US CPI update, Mish highlights the possible opportunities in the Wednesday, August 9 trading session for the S&P 500 and three key commodities on CMC Markets.
In this appearance on Fox Business’ Making Money with Charles Payne, Mish and Charles cover Fed, oil and gas, and some picks for a manufacturing boom.
Mish and Nicole Petallides discuss market in correction, oil concerns, and some new picks on TD Ameritrade.
Mish runs the rule over the S&P 500 and key commodities in this video from CMC Markets.
Mish gives reasons why gold could return as a safe haven on Business First AM.
Mish talks about opportunities related to EVs in this video from Business First AM.
Mish and Jared go over oil and what might happen with small caps and regional banks in this appearance on Yahoo! Finance.
Coming Up:
August 10: Mario Nawfal Financial Spaces, 8am ET & Benzinga Morning Prep Show & The Final Bar on StockCharts TV & CNBC Asia
August 17: Real Vision Daily Briefing
August 28: Chuck Jaffe, Money Show
September 7: Singapore Breakfast Radio, 89.3 FM
October 29-31: The Money Show
ETF Summary
S&P 500 (SPY): 450 pivotal, 440 support at the 50-DMA.Russell 2000 (IWM): 191 is the 23-month holy grail, 194 July 6-month range high.Dow (DIA): 35,000 support.Nasdaq (QQQ): 362-382 range.Regional Banks (KRE): 50 in focus if holds around 48.Semiconductors (SMH): 161 resistance-150 in focus.Transportation (IYT): July 6-month calendar range high at 259.30 and 254 some support.Biotechnology (IBB): Compression between 123-130.Retail (XRT): 66-67.40 short-term range (closing levels matter).
Mish Schneider
MarketGauge.com
Director of Trading Research and Education