
After the Fed meeting, we thought it would be useful to see the July calendar ranges and give you a brief lesson in how to use them. Who is this for?
The price levels defined by this trading method have proven to be insightful in all markets. Longer-term investors can use this to identify longer-term trend inflection points. Active investors can use the price levels identified by the July Range as entry points for trades that can last days, weeks, or months.
Focusing on the July Calendar Range Breakout only:
• The “Close & Continue” Breakout Pattern
“Close” outside the range “Continue:” Trade beyond the range of the breakout day
With an intra-day 30-min Opening Range breakout:
• Stop levels
Close back in the range Move below (above) the range of the day that broke out Close & continue beyond the opposite range level
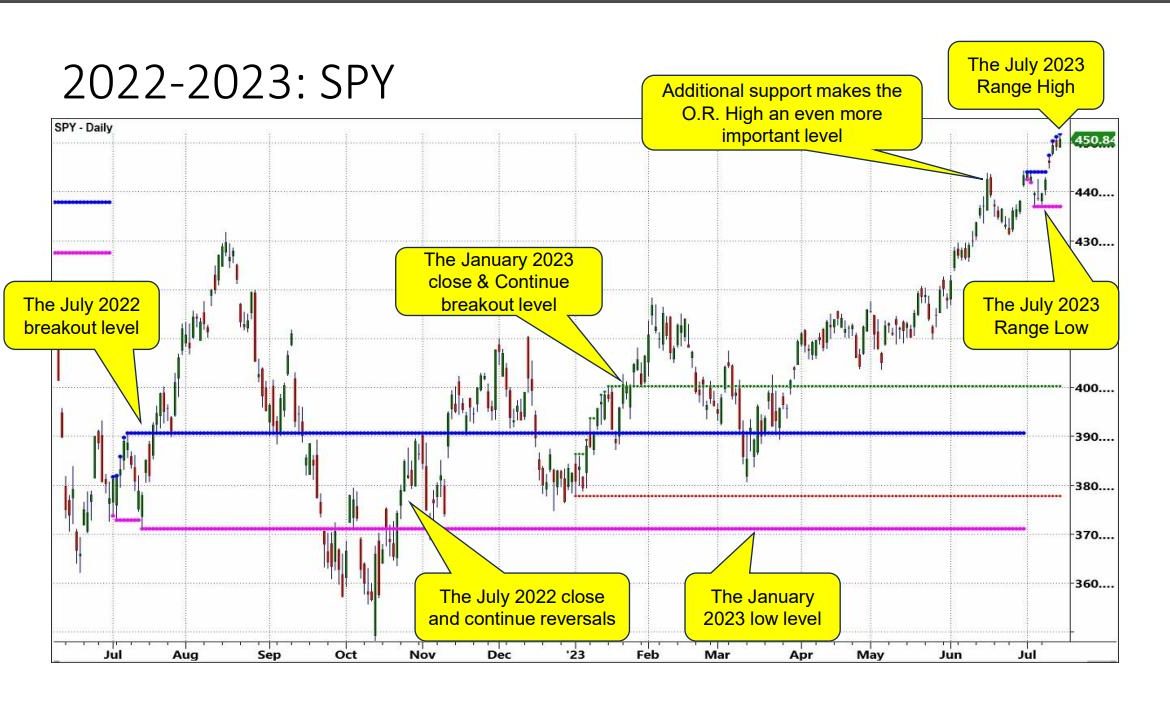
Looking at the SPY chart, we have had 7 trading days above the range high. However, to date, SPY has not really taken off from that level and sits more in consolidation mode.
451.93 is the green line or 6-month calendar range high. Should it hold, we would maintain a positive bias. Should it fail, we would most likely exit any long SPY position. And, should it continue to fail below the range high, we would consider that a potential short and perhaps top for the market-until such time-the price comes back above that level. At that point, the July 6-month calendar range low at 437.06 comes into focus.
Pay attention to the 6-month January 2023 calendar range as well as the July 2022 6-month calendar range. Most types of investors had lots of trading opportunities around these lines in the sand.
See more:
NASDAQ is already below its July 6-month calendar range. We are now watching the low at 363.41 as the next point. A break below would tell us the uptrend, for now, is over.
The Russell 2000 looks similar to the SPY chart. Currently trading above the 6-month range, the bias is positive unless the July range high breaks. Notice the distance between the July 6-month range high and low. That tells us that even with a break below, we have substantial room to fall without breaking the overall uptrend. This is unique to IWM, our main index focus for the 2nd half of 2023.
The most interesting chart for us is the long bonds or TLT chart. The “higher for longer” folks want to see TLT break under the July range low or 98.85. The “last rate hike before a pause and a pivot” crowd will want to see TLT clear above the July range high or 103.26. Note that once TLT failed the January 6-month calendar range high, it tested and held the 6-month calendar range low.
Now, with a new range, hopefully the next direction for bonds and rates will become clearer.
This daily is an abbreviation of MarketGauge’s 6-Month Calendar Range strategy setup and indicators. This strategy, tactics used to trade it, and market scans used to identify trading opportunities are covered in our ‘Complete Trader’ and ‘Mish’s Training’ programs. If you’d like to take this to the next level with more detailed instruction, the indicators, additional trade ideas, and live mentoring…
Click here to learn more: http://www.marketgauge.com/calendar-ranges
For more detailed trading information about our blended models, tools and trader education courses, contact Rob Quinn, our Chief Strategy Consultant, to learn more.
“I grew my money tree and so can you!” – Mish Schneider
Get your copy of Plant Your Money Tree: A Guide to Growing Your Wealth and a special bonus here.
Follow Mish on Twitter @marketminute for stock picks and more. Follow Mish on Instagram (mishschneider) for daily morning videos. To see updated media clips, click here.
Mish in the Media
This has been a very heavy week with the Fed meeting, tons of earnings, and, not to mention, all of the geopolitical issues around the world. Something that Mish has been thinking a lot about is store houses for raw materials, the places that actually hold every kind of raw material from mining, commodity trading houses etc. Mish dives into the stocks she’s looking at on the Wednesday, July 26 edition of StockCharts TV’s Your Daily Five.
Mish looks at a selection of popular instruments and outlines their possible direction of travel in this video from CMC Markets.
In this episode of The Breakfast Show from Money FM 89.3 Singapore, Mish makes sense of the recent resilience and worrisome trends in the market, delving on the various factors driving consumer confidence in the face of rising rates and inflation, the impact of A.I.-driven companies, and the ongoing geopolitical risks on commodities and equities.
Mish talks PCE inflation picks in this video from Business First AM.
Mish covers gold, oil, grains and the SPX — all actionable — in this video from CMC Markets.
Mish discusses recession, inflation, and AI picks on the open with BNN Bloomberg.
Mish and Angela Miles discuss the next moves for your money on Business First AM.
Mish talks her approach to being a professional trader in this Options Insight interview with Imran Lakha.
Nicole Petallides and Mish discuss crypto, basic materials, inflation and gold in this appearance on TD Ameritrade.
Mish and Ash Bennington cover a lot in this video from Real Vision, discussing everything from the Fed, to inflation, to the incredible move in stocks and what is next.
Mish talks day-trading tactics, currency pairs, gold, oil, and sugar futures in this video from CMC Markets.
Mish and Angie Miles talk tech, small caps and one new stock in this appearance on Business First AM.
Mish examines the old adage “Don’t Fight the Fed” in this interview on Business First AM.
Mish and Charles Payne talk the Fed, CPI, Inflation, yields, bonds and sectors she likes on Fox Business’ Making Money with Charles Payne.
Mish, Brad Smith and Diane King Hall discuss and project on topics like earnings, inflation, yield curve and market direction in this appearance on Yahoo Finance.
Coming Up:
July 27: Live Coaching
July 28: IBD Live
ETF Summary
S&P 500 (SPY): 452 July calendar range high now support.Russell 2000 (IWM): 193 is the 23-month holy grail.Dow (DIA): 35,000 support.Nasdaq (QQQ): Under its 6-month calendar range high, already showing signs of stress.Regional Banks (KRE): Consolidating over its July calendar highs; positive.Semiconductors (SMH): Holds here okay; needs to clear 161, under 147 trouble.Transportation (IYT): No UPS strike helped.Biotechnology (IBB): 128 support now to hold.Retail (XRT): Rally to the July 6-month calendar range high — now the fun begins.
Mish Schneider
MarketGauge.com
Director of Trading Research and Education