
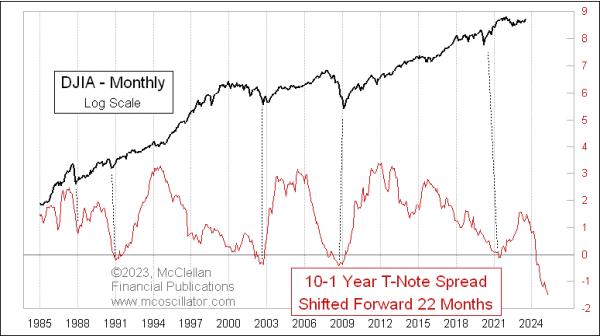
A year ago, I noted that the inverted yield curve was saying that a bottom for stock prices could be expected in 2024. But the important caveat to that expectation was that it depended upon the yield curve finishing its inversion then. What has happened instead is a furthering of that inversion, which will add fuel to the coming bear market and which postpones its end date.
In the chart above, I am modeling the entirety of the yield curve by comparing just two rates: the 10-year and 1-year T-Note yields. Picking just two gives us the ability to calculate a spread between them, which makes for a nice display on a 2-dimensional chart. The actual “yield curve” consists of all possible market yields on bonds from the shortest to longest maturities.
The key point in the first chart above, which compares that 10y-1y spread, is that I have shifted forward that yield spread plot by 22 months. This helps to reveal how the stock market responds with a delay to the inversion of the yield curve. And the moment of the greatest inversion is the key moment to count forward from, because stock market bottoms tend to arrive about 22 months later, on average.
We do not know yet when the most extreme point will be reached for the 10y-1y yield spread. But if it was today, then that would mean a stock market bottom in roughly May 2026. If the Fed keeps pushing up the short end of the maturity spectrum, as they did with the July 26, 2023 additional quarter point hike from the FOMC, then that postpones that bottom date for the stock market even further.
It is worth noting a glaring exception to this 22-month lag principle. We saw a very minor yield curve inversion in August to September 2019, which should have meant a bottom for the stock market ideally in June to July 2021. But we saw the bottom come much earlier, in March 2020, thanks to the arrival of COVID and the decisions by our governmental leaders to first shut down the economy (2 weeks to stop the spread), and then to shove a firehose full of money into the economy’s mouth. Those actions pulled forward the stock market bottom that ideally should have come in 2021.
While the stock market reacts to the yield curve with a lag, there is another very important relationship regarding the yield curve, which acts on a coincident basis:
The yield curve and the unemployment rate are very tightly correlated. But, when thinking about cause and effect, the yield curve is not the causative agent. The yield curve gets changed mostly by Fed action, and the policy makers react to what unemployment is doing. When unemployment is rising, the Fed will cut short-term rates, steepening the yield curve. And they do the opposite when unemployment is low, based on their belief that this will somehow help to remediate inflation. My longtime readers know that the Fed is not really in charge of inflation, as discussed here.
The key point to notice, though, in this comparison of the 10y-1y spread to the unemployment rate is that EVERY TIME we see an inverted yield curve, it produces a dramatic rise in the unemployment rate in the months that follow. This time, the unemployment rate is taking a while to respond, which is great for those who still get to have jobs. The Fed seems to think that perhaps this time is different, and they can bring about a “soft landing” or “no landing” scenario regarding unemployment. History says that is a pretty foolish belief. Unemployment going up has always signaled that the end of the inverted yield curve is upon us.