
Originally written Sunday, July 16.
The bull market in stocks continues to power higher, but there are signs of money moving into sectors beyond AI and the homebuilders. Meanwhile, the Fed is going to have a hard time excusing what is almost a certain rate hike at its late July FOMC meeting (July 25-26), as both CPI and PPI seem to have topped out, at least temporarily.
But with less than two weeks left before the Fed, we could see one more push up in stocks, as there are still plenty of non-believers in the current bull market who have missed the rally.
Bond Yields Tumble on Falling Inflation
The bond market responded, as would be expected, with a rapid reversal of the recent uptick in yields. And while bond traders got caught by surprise, we weren’t. Moreover, the stock market’s recent breadth resilience suggests that, for now, stocks were right and bonds were wrong about inflation.
Last week in this space, I noted that the now forgotten ADP private payroll data’s stronger-than-expected print had spooked bond traders, despite a weaker-than-expected government payroll report and plenty of soft data from ISM and related reports. I also noted that the odds for a reversal in bond yields, which would be positive for stocks, was likely.
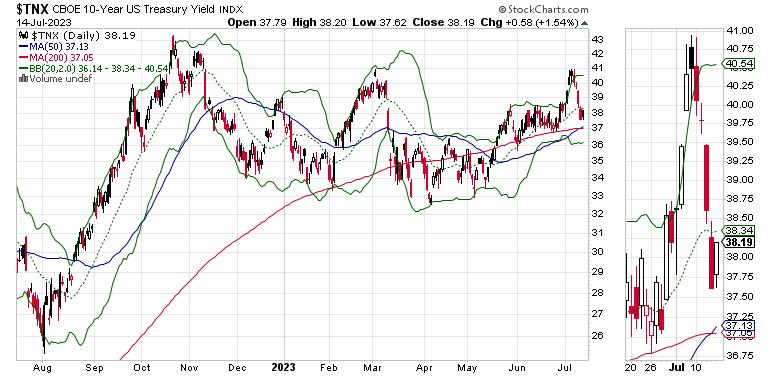
So far, so good. The U.S. Ten Year Note yield (TNX) reversed course and could well test of the lower end of its recent trading range. This trend is still unresolved, as economic data and the Fed will continue to influence traders.
A move below 3.7% would be a sign that bond traders are no longer worried about inflation.
Where the Stealth Money Trail Leads
Much of what happens next depends on the Fed. Meanwhile, here’s where things stand:
The market could still rally further before getting the yips ahead of the Fed;Market leadership (AI and Homebuilders) is due for a consolidation; andStealth Money is quietly moving into previously forgotten areas of the market.
Currently, money is quietly moving into out-of-favor sectors of the stock market, which, under the right set of conditions, may be the next market leaders. I call this dynamic Stealth Money; it’s also known as smart money. It describes what money managers do to get ahead of the crowd. And as I described in my latest Your Daily Five video, this quiet deployment of smart money leaves footprints, which I describe here every week via the trends for Accumulation/Distribution (ADI), the On Balance Volume (OBV) and Volume by Price (VBP) indicators.
Together, these three gauges point to where smart money is moving.
Here’s a great example of how it works: real estate investment trusts (REITS).
Consider this. Commercial real estate (CRE) is in trouble, especially the stocks those companies who own office buildings in large cities such as San Francisco, New York, and Los Angeles as the work-from-home dynamic has reduced the need for office space.
As I’ve chronicled for months, CRE loan defaults are climbing, the glut of office space is rising, and panic is spreading. Here is a recent example.
Yet, as the price chart for the iShares U.S. Real Estate ETF (IYR) shows, money is moving into REITs. That’s what I mean when I say Stealth Money. Moreover, when this type of situation gains a foothold, as it seems to have done with the REITs, it usually marks a bottom and is often a prelude to a long-term bull run.
The Inside Scoop
I get questions from subscribers about my approach to the markets, which can be summed up in two phrases:
Monitor the News; andTrade the Markets.
So, let’s look at the market’s inner workings by inspecting the ADI, OBV, and VBP indicators for the IYR ETF, above.
ADI offers a glimpse into the actions of short sellers. OBV illustrates what buyers and sellers (investors) are doing. And VBP bars tell us where key support and resistance levels are located.
OBV and ADI stabilized in October 2022. That signaled that short sellers (ADI) were pulling back and that outright unhappy stockholders /sellers (OBV) also took a step back. The relief of the downward pressure created by both short sellers and people wanting to get out of the REITs left enough buyers in the mix to push prices higher until January 2023. That’s when the sellers (a renewed down leg in OBV) came back. This was a sign that those who bought back in August 2022 had gotten enough of their money back and decided to call it a day.
But if you look at ADI (short sellers), you can see that it started moving sideways. So the fall in OBV was a sign that panic had set in. Meanwhile, the short sellers didn’t take the bait. That means that when the selling was done (OBV) turned up in March 2023, there was little selling pressure left and the REITs could start to climb as the Stealth Money moved in.
So where does VBP come in? Right around the $84 mark, there were consolidation patterns in November/December 2022. Also note that the panic sellers broke through $84 on the way down. But in June 2023, prices moved above $84. In other words, the $84 price level has been the line in the sand. If prices hold above $84, they are likely to move higher as buyers prevail. A fall below $84 means the sellers are in charge.
Finally, note IYR has crossed above its 20,50, and 200-day moving averages as OBV and ADI are rising.
The takeaway message is that Stealth Money is active in the REITs. But it’s not likely to be stealthy much longer as the market is starting to catch on.
Incidentally, if you’re looking for more in depth actionable data on real estate, check out my Weekly Real Estate Report here. In addition, I have recently added several REITs to my model portfolio. You can have a look with a FREE trial to my service here.
NYAD Due for a Breather
The long term trend for stocks remains up.
In the short term, the New York Stock Exchange Advance Decline line (NYAD) is overextended in the short term, having closed outside its upper Bollinger Band on 7/14/23 and moving back inside on 7/15. Thus, some sort of consolidation is likely in the short term.
In the long-term, the trend remains up for stocks, as NYAD is above its 50- and 200-day moving averages.
The Nasdaq 100 Index (NDX) is also overdue for a consolidation, as illustrated by its reversal on 7/15/23, outside the upper Bollinger Band. ADI and OBV have rolled over in the short term, but both remain in uptrends. Support is at 15,100.
The S&P 500 (SPX) is acting similarly. Both ADI and OBV are showing signs of some profit-taking. There is support at 4400.
VIX Holds Steady
I’ve been expecting a move higher in VIX, but it hasn’t materialized. When this happens, it usually leads to stable-to-higher stock prices. The key is whether VIX can rise above the 15 level convincingly.
When the VIX rises, stocks tend to fall, as rising put volume is a sign that market makers are selling stock index futures to hedge their put sales to the public. A fall in VIX is bullish, as it means less put option buying, and it eventually leads to call buying, which causes market makers to hedge by buying stock index futures. This raises the odds of higher stock prices.
Liquidity Remains Stable
As it has for the past few weeks, liquidity has been stable. This is one of the reasons the market has been in a bullish trend. The Eurodollar Index (XED) remains rangebound, which is relatively bullish. A move below 94 would be very bearish.
A move above 95 will be a very bullish development. Usually, a stable or rising XED is very bullish for stocks.
To get the latest information on options trading, check out Options Trading for Dummies, now in its 4th Edition—Get Your Copy Now! Now also available in Audible audiobook format!
#1 New Release on Options Trading!
Good news! I’ve made my NYAD-Complexity – Chaos chart (featured on my YD5 videos) and a few other favorites public. You can find them here.
Joe Duarte
In The Money Options
Joe Duarte is a former money manager, an active trader, and a widely recognized independent stock market analyst since 1987. He is author of eight investment books, including the best-selling Trading Options for Dummies, rated a TOP Options Book for 2018 by Benzinga.com and now in its third edition, plus The Everything Investing in Your 20s and 30s Book and six other trading books.
The Everything Investing in Your 20s and 30s Book is available at Amazon and Barnes and Noble. It has also been recommended as a Washington Post Color of Money Book of the Month.
To receive Joe’s exclusive stock, option and ETF recommendations, in your mailbox every week visit https://joeduarteinthemoneyoptions.com/secure/order_email.asp.