
The AI rally looks set to take a breather. But the rally in oil may just be getting started.
All bets are off for the stock market when the Fed meets later in July. But, until then, stocks retain an upward bias, albeit one with the potential for bumpiness and a likelihood for selectivity. That’s because the recent buzz on AI is starting to fade.
On the other hand, as I noted last week, and further detail below, the oil service sector is suddenly a money magnet.
Bonds Yields Look Top Heavy
At first glance, the first week of the most bullish month of the year for stocks was a bust, as the Fed revived the specter of higher interest rates and the ADP private employment data spooked bond traders, raising yields above the bearish 4% point. This bearish posture in bonds persisted despite a weaker-than-expected payroll report and the usual soft data from ISM and related reports.
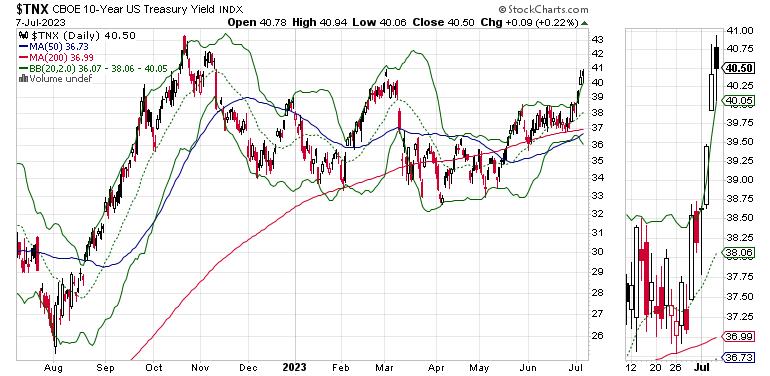
Yet even as the bond bears growl, the U.S. Ten Year Note yield price chart has the look of a potential top, while the market’s breadth seems to have survived yet another scare.
Note the yield closed above the upper Bollinger Band, which means it is overextended. The RSI is also near 70, signaling an overbought condition and confirming that a reversal is in order. In addition, since all price gaps are eventually filled, such as the one between 3.95% and 4% in this chart, we may see TNX retrace its steps back to 3.95% or even to the 20-day moving average. If that happens, I would expect one last move up by stocks before the Fed meets on 7/25-26.
Still, there are rising expectations of a 25-basis point increase in the Fed Funds rate after the Fed’s next FOMC meeting (7/25-26). If the central bank does raise rates, the Fed Funds target rate would likely be between 5.25% and 5.5%.
That means that the next round of CPI and PPI numbers are likely to be market movers, since a move above or below expectations could affect the Fed’s decision. Of course, if these inflation numbers follow last month’s cooling trend, the bulls are likely to be further pleasantly surprised.
Oil Service Delivers a Gusher as Supply Realities Solidify
Let’s take a walk down memory lane. In my Market Summary dated 5/28/23, titled “Never Short a Dull Market“, I wrote the following: “There’s an old adage of Wall Street, which says: ‘never short a dull market.’ And while AI is getting all the press these days, the oil market is about as dull as it gets. This, of course, brings the energy sector to the top of my contrarian alert list.
“This is not to say that I’m buying oil-related assets with both hands. It just means that, at this point, it makes more sense to look at energy as a value asset which is oversold and ripe for a move up whenever the right set of variables required to deliver such a move line up just right. In the current world, the variables could line up just right as early as today.”
The variables have lined up.
Fast forwarding; last week in this space I wrote: “some portfolio managers use the cover of window dressing as a stealthy way to put money to work in sectors that offer value. As a result, while everyone is looking at the hot sectors, such as AI, it pays to look at sectors that have underperformed in the first half. One of them is oil service.”
I then added: “the Van Eck Vectors Oil Service ETF (OIH), has crossed above its 200-day moving average, marking what looks to be the start of a bullish reversal.”
As a result, I wasn’t surprised at the breakout in the sector. But I was impressed by its magnitude, as OIH rallied a nifty 6.38% on 7/7/23 on big volume. Moreover, the Accumulation/Distribution indicator (ADI) moved decidedly higher, a sign that short sellers are stampeding out of the sector. Even more encouraging is the improvement in On Balance Volume (OBV), signaling that buyers are coming in.
The key to whether this trend lasts is what happens to oil supplies over the next few weeks to months. If current trends continue, they will be squeezed as long as OPEC and Russia stick to their promised cuts in production. In addition, U.S. shale producers have been steadily decreasing their own production, setting up the potential for higher or stable prices even if demand remains lower than average. The latest U.S. crude supplies from the Energy Information Agency paint a picture of a stable market for current demand with decreasing oil production and average storage levels.
So why are oil service stocks rising? The short answer is that, as production is being reduced, exploration is rising, especially in Latin America and Africa. According to industry insiders, this is a long term “super cycle” type event. This means that oil service stocks are in the driver’s seat for a potential earnings winning streak.
Incidentally, if you’re looking for more in-depth actionable data on oil service stocks, I have recently added several oil related stocks to my model portfolio. You can have a look with a FREE trial to my service here. And for a comprehensive analysis on the state of the oil market, grab a copy of this exclusive report here.
NYAD Again Survives the Sellers’ Wrath; Sellers Appear in NDX and SPX
Despite the aggressive midweek selling spree, the New York Stock Exchange Advance Decline line (NYAD) remained in an uptrend as it held above its 50- and 200-day moving averages. This remains encouraging in the short term. The outlook for stocks would be better, though, if NYAD made a new high fairly soon.
The Nasdaq 100 Index (NDX) looks set for some sort of pullback as AI stocks are losing their luster. ADI and OBV have rolled over here, which means sellers and short sellers are starting to take control.
The S&P 500 (SPX) is also weakening. Both ADI and OBV are rolling over.
VIX Remains Range-Bound
After its recent new lows, the CBOE Volatility Index (VIX) is poised to rise, as July often marks a bottom. The key is whether it can rise above the 15 level convincingly.
When the VIX rises, stocks tend to fall, as rising put volume is a sign that market makers are selling stock index futures to hedge their put sales to the public. A fall in VIX is bullish, as it means less put option buying, and it eventually leads to call buying, which causes market makers to hedge by buying stock index futures. This raises the odds of higher stock prices.
Liquidity Remains Stable
Liquidity remains encouraging, although it’s not wholly bullish. The Eurodollar Index (XED) remains rangebound, which is relatively bullish. A move below 94 would be very bearish. A move above 95 will be a very bullish development. Usually, a stable or rising XED is very bullish for stocks.
To get the latest information on options trading, check out Options Trading for Dummies, now in its 4th Edition—Get Your Copy Now! Now also available in Audible audiobook format!
#1 New Release on Options Trading!
Good news! I’ve made my NYAD-Complexity – Chaos chart (featured on my YD5 videos) and a few other favorites public. You can find them here.
Joe Duarte
In The Money Options
Joe Duarte is a former money manager, an active trader, and a widely recognized independent stock market analyst since 1987. He is author of eight investment books, including the best-selling Trading Options for Dummies, rated a TOP Options Book for 2018 by Benzinga.com and now in its third edition, plus The Everything Investing in Your 20s and 30s Book and six other trading books.
The Everything Investing in Your 20s and 30s Book is available at Amazon and Barnes and Noble. It has also been recommended as a Washington Post Color of Money Book of the Month.
To receive Joe’s exclusive stock, option and ETF recommendations, in your mailbox every week visit https://joeduarteinthemoneyoptions.com/secure/order_email.asp.