
Week Ahead: NIFTY May Take A Breather And Consolidate; Pick Stocks In A Selective Way
In the previous weekly technical outlook, it was mentioned that the markets have attempted a strong breakout which can be termed as one of the major ones; this week, it showed some signs of tiredness while still managing to end the week on a positive note. The markets evidently showed some signs of consolidation as the trading range also got narrower; against the 555-points trading range in the week before this one, the NIFTY oscillated in just 289.20 points over the past five sessions. The last trading day of the week saw Nifty shedding 165.50 points; despite this, the headline index ended at a fresh lifetime high and managed to end the week with a net gain of 142.75 points (+0.74%) on a weekly basis.
The high point of the previous week, i.e., 19523.60 may act as an intermediate top for the markets over the immediate short term. There are high possibilities that the market consolidates with the level of 19500 acting as a strong resistance going on now from here. The up moves shall resume and the breakout will get extended only after 19500 is taken out by Nifty. On the lower side, the index has dragged its supports higher to 18800-19000 levels. The volatility also spiked; the INDIAVIX surged by 6.78% to 11.53 on a weekly note; this also remains one of the lowest levels seen over the recent past.
The coming week is likely to see a quiet start to the day. The levels of 19430 and 19550 are likely to act as resistance levels; the supports would come in at 19100 and 18900 levels.
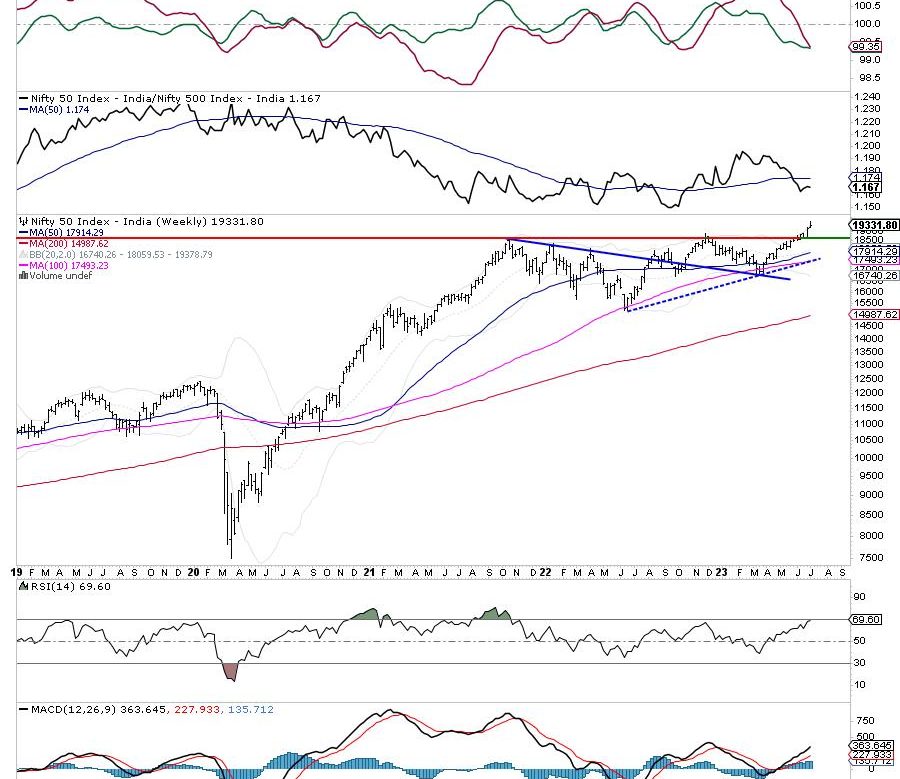
The weekly RSI is 69.60; it has marked a new 14-period high; however, it remains neutral and does not show any divergence against the price. The weekly MACD is bullish and stays above the signal line.
A Shooting Star appeared on the weekly candles; such a formation occurs when the price opens high and gets higher but closes well off its high point. This has the potential to put a temporary top in place and halt/disrupt the current up move and send the index in some consolidation. On the daily chart, a formation of a bearish engulfing candle warrants some caution as well.
All in all, we are unlikely to see any specific sectors dominating the space; it is very much possible that the markets get highly stock-specific once again, and require a highly selective approach from us. It would be wise to chase the up moves on a highly selective note; an equal emphasis should also be laid on protecting profits on those investments which have run up too much ahead of the curve. With the possibility of some range-bound consolidation taking place, shorts must be avoided but fresh purchases may be made on a highly selective basis. A cautiously positive outlook is advised for the coming week.
Sector Analysis for the coming week
In our look at Relative Rotation Graphs®, we compared various sectors against CNX500 (NIFTY 500 Index), which represents over 95% of the free float market cap of all the stocks listed.
The analysis of Relative Rotation Graphs (RRG) shows Nifty Realty, Auto, Consumption, and Midcap indices inside the leading quadrant. This ensures relative outperformance from these pockets against the broader markets.
Nifty PSE, Infrastructure, and Banknifty stay inside the weakening quadrant. Stock-specific performance may be seen but overall these groups may not show any strong outperformance.
The Financial Services and the Pharma index have rolled inside the lagging quadrant. The commodities index is also inside the lagging quadrant along with the Services sector index. The Nifty PSU Bank and the IT index are also inside the lagging quadrant but they are seen improving their relative momentum against the broader markets.
While Nifty Metal and the Media indices are comfortably placed inside the improving quadrant, the Energy index, which is also inside the improving quadrant is seen giving up on its relative momentum against the broader markets.
Important Note: RRG™ charts show the relative strength and momentum of a group of stocks. In the above Chart, they show relative performance against NIFTY500 Index (Broader Markets) and should not be used directly as buy or sell signals.
Milan Vaishnav, CMT, MSTA
Consulting Technical Analyst