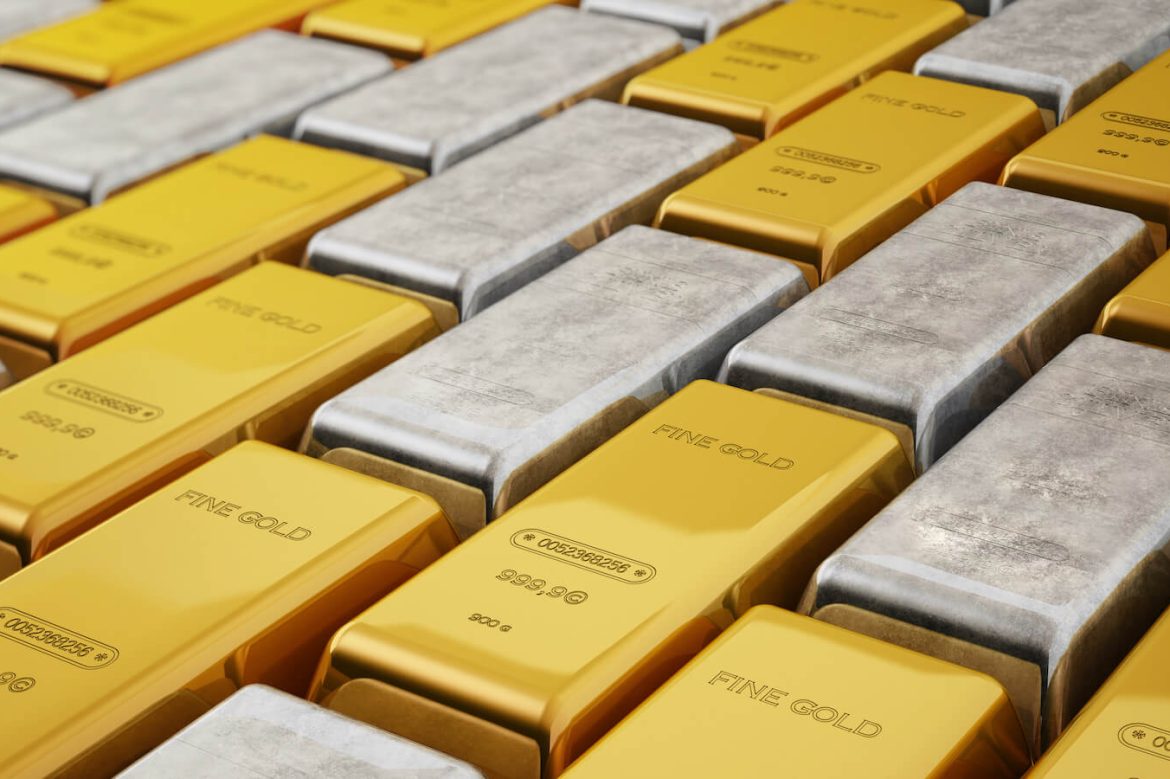
Gold and silver prices fell on Thursday morning after the US ADP report showed the largest monthly increase since July 2022. The private sector added 497,000 in June, more than twice what economists had expected. At the time of writing, the DJIA plunged nearly 500 points, while gold and silver fell 0.38% and 1.93%, respectively. The report also pushed the US Dollar and US Treasury yields higher.
What’s Causing the Market Reaction?
Three words: Rate hike fears.
Yet gold and silver are at a critical “technical” juncture.
Gold and silver have followed a bearish trend over the last two months. Still, bulls can find a couple of compelling reasons why the ‘correction’ might be at an end. Gold bears had the opportunity to push the yellow metal (COMEX) below $1,900. That was a big fail. Bearish pressure on silver prices, on the other hand, saw a strong rebound at the 200-day simple moving average (SMA).
If you look at gold and silver using their ETF proxies—SPDR Gold Shares ETF (GLD) and iShares Silver Trust ETF (SLV)—you see the same dynamics as in their COMEX futures counterparts.
CHART 1: DAILY CHART OF SPDR GOLD SHARES ETF (GLD). GLD appears to be rebounding from its two-month decline.Chart source: StockCharts.com (click on chart for live version). For educational purposes.
Bears have been in control for a while now, but they’re facing some obstacles ahead. Their immediate goal is to push GLD below its $175 support level, corresponding to a COMEX gold price of $1,900. After that, they’re aiming for the February lows of $173 and then $168 (dashed green lines). On the other side—the bulls—are up against tough resistance levels at $180 and then $184 (red dashed lines), with the latter matching up with a COMEX gold price of $2,000.
Making These Levels Actionable. Actionability depends on whether you’re biased toward the bull or bear side.
If you’re bullish, the upside resistance levels can serve as near-term profit targets. The downside targets can be potential entry points to scale in your long position.If you’re bearish, the upside targets can serve as potential entry points for a short position, while the downside support levels serve as your profit targets.As far as stop losses are concerned, it depends on your trading method. Some traders prefer to place stops at the opposite swing low or high (depending on whether you’re going long or short).
This applies to SLV’s chart below. Note that a break below SLV’s 200-day SMA may provide an immediate trade entry signal should the price cross below and close below the moving average. Speaking of SLV, let’s get to that chart next.
CHART 2: DAILY CHART OF ISHARES SILVER TRUST ETF (SLV). SLV is bouncing resiliently off its 200-day SMA.Chart source: StockCharts.com (click chart for live version). For educational purposes.
Bears are facing immediate challenges as SLV has been rebounding quite resiliently off the 200-day moving average Still, their goal remains to force SLV below the 200-day SMA with possible objectives at historical support/resistance areas at $19.50, $18.80, and $18.35. As for the bulls, SLV faces resistance at $22.50.
Looking at Support and Resistance on a Weekly Scale
On a weekly scale, widening your view to a four-year lookback, you can see how strongly markets have reacted at the $186.00 (resistance) and $165.00 (support) levels. Note that GLD has attempted to break above the $186.00 level three times in four years but failed at each attempt.
CHART 3: WEEKLY CHART OF SPDR GOLD SHARES ETF (GLD). Looking back four years, you can see the most heavily traded areas and how those areas have contained most of the price action since mid-2020.Chart source: StockCharts.com (click on chart for live version). For educational purposes.
Volume by Price reflects the significant amount of trading at these levels. Looking forward, you can expect that these “popular” levels may continue to hold unless compelling fundamental factors give bulls or bears a reason to break the range.
As for silver, looking back over the last two decades, there’s a strong range of support within the heavily traded range of $16.00 to $18.50 (green dashed lines).
CHART 4: WEEKLY CHART OF ISHARES SILVER TRUST ETF (SLV). Over a 20-year lookback period, $25.50 looks pretty formidable, as does $16.00.Chart source: StockCharts.com (click chart for live version). For educational purposes.
The level of $25.50—the 2011 low above which SLV attempted to break above four times between 2020–2022—marks a strong level of resistance that SLV will eventually have to challenge should it get above $22.50 and then $24.00.
The Bottom Line
The recent rise in employment figures has spurred concerns over potential rate hikes, significantly impacting gold and silver prices. However, current market dynamics suggest that gold and silver are at a critical technical juncture, showing signs of resilience despite ongoing bearish trends.
Crucial support and resistance levels have been highlighted for both metals, indicating potential thresholds for future movements. While the bears have their sights set on pushing prices below these support levels, the bulls face an uphill battle against formidable resistance. Ultimately, the path forward depends on how well each side can navigate these obstacles and how future fundamental factors influence investor sentiment. For now, all eyes remain focused on these key price points as the struggle between bulls and bears continues to play out.
Disclaimer: This blog is for educational purposes only and should not be construed as financial advice. The ideas and strategies should never be used without first assessing your own personal and financial situation, or without consulting a financial professional.

