
The first thing I always look at are the technical conditions. For me, that’s a very simple analysis of price/volume. Here’s what that looks like right now on the S&P 500 and NASDAQ 100:
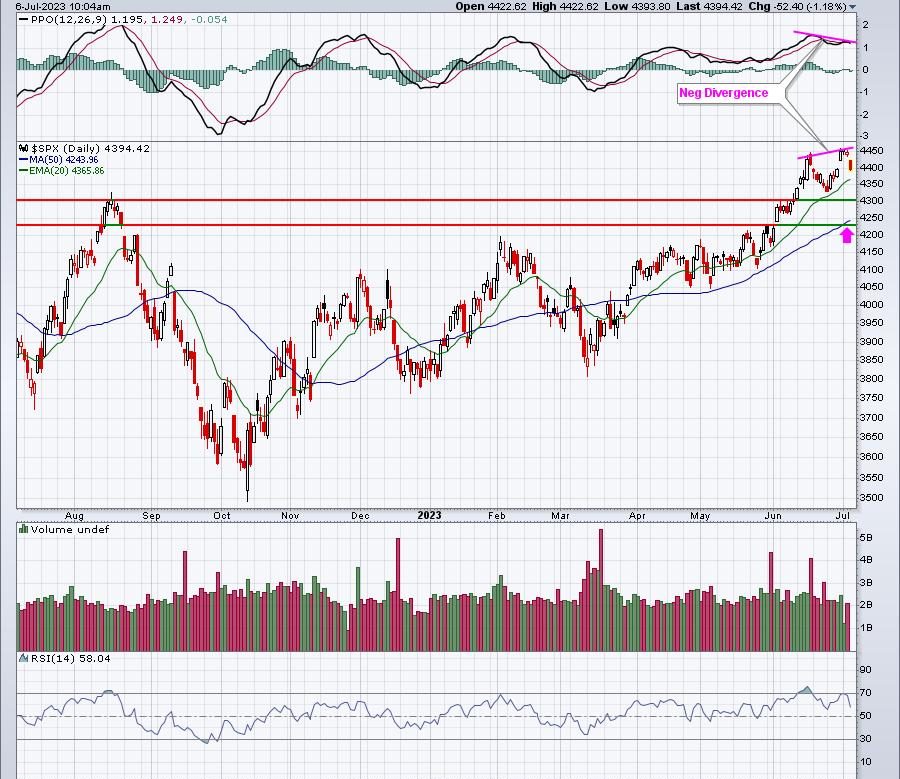
S&P 500 ($SPX):
During any uptrend, I look to the 20-day EMA as my initial key short-term support. I typically view the odds of a successful test as quite strong – unless there’s a negative divergence. In this case, there is one. So we need to consider that the odds have shifted a bit more toward a 50-day SMA test (pink arrow).
NASDAQ 100 ($NDX):
We’ve been spoiled on the long side with a mostly straight-up advance. The short-term selling could be problematic, because we haven’t see an extended slide for awhile and there’s a catalyst that could push stock prices lower near-term. Higher treasury yields have resulted in a falling market over the past year and a half. While I believe the stock market has handled rising yields very well in 2023, it’s certainly not immune to a period of selling.
There are signals that tell me this pullback will be temporary. The primary signal is that we’ve not seen any significant rotation to defensive sectors. Since topping on the S&P 500 on June 15th at 4425, we’ve seen slightly higher prices before the selling the past couple days. If you recall, at the end of 2021, the final ultimate high was accompanied by heavy rotation into defensive sectors. Over the past three weeks, here’s the performance of all 11 sectors:
Does this look like a mass exodus out of aggressive sectors? I don’t think so, considering that four of the top six sectors since June 15th are aggressive sectors. And most of the selling in technology (XLK) has been via gaps. Check out the candles the past few days on the XLK:
We’re seeing technology down for the third consecutive session, but do you see intraday selling? There’s not one red-filled candle of any significance this week as the XLK drifts lower. It’s all gap downs again. We saw this through the first 5 months of 2022 when retail traders were swindled by Wall Street. There were months of gap downs and early morning selling, followed by significant accumulation. This week has been nothing more than a mini-version of the manipulation we saw repeatedly last year.
I’ll be spending a lot of time this evening providing our “Bulls-Eye Forecast: Mid-Year Update”, highlighting areas of strength and weakness during the first half of 2023 and what we should expect in the second half. It’s a FREE event, open to the public, so I hope you’ll join me. When you register, and as further incentive to join me, I’ll provide you a “Money Flows” pdf, which highlights much of the manipulation that’s taken place on Wall Street since 1950. I believe every investor/trader should be aware of this manipulation, which is why I’m including it for FREE. Please register NOW as this must-attend event is today at 7:00pm ET. To register, CLICK HERE. Upon registration, we’ll immediately send you this FREE “Money Flows” pdf, which will significantly impact your approach to investing/trading!
Happy trading!
Tom