
Near Term Rotations
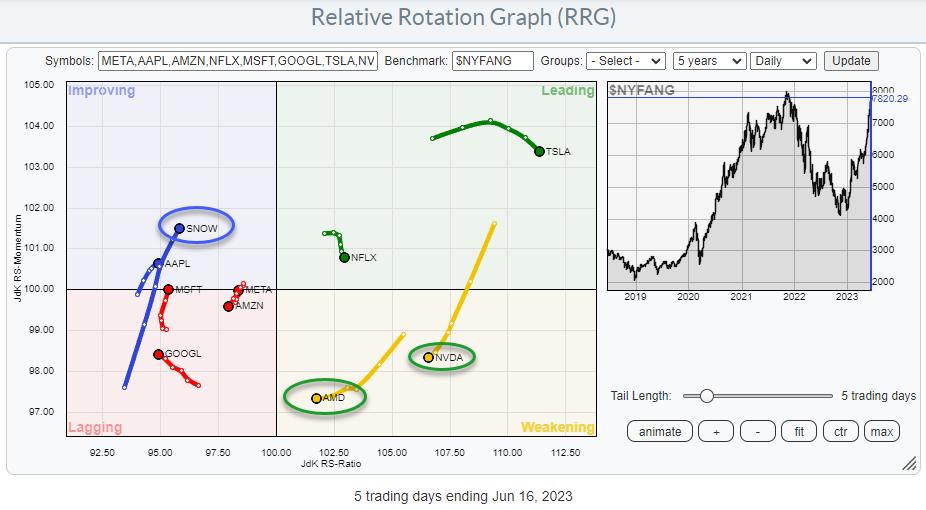
The Relative Rotation Graph above shows the Stock rotation inside the NYFANG index.
Semiconductor stocks AMD and NVDA have been the leaders over the past weeks/months, but they are now rolling over into weakening and heading toward the lagging quadrant. TSLA and NFLX are still inside the leading quadrant, but their tails have already started to roll over, i.e., lose relative momentum.
On the other side, we find MSFTm, AAPL, and SNOW picking up steam and starting a trajectory toward the leading quadrant, but the move is in its early stages.
The rotation suggests that AMD, NVDA, and, to a lesser extent, NFLX and TSLA are setting up for a pause, and the NYFANG index now needs SNOW, AAPL, and MSFT to take over to maintain its bullish character.
AMD
AMD is rapidly heading towards the lagging quadrant on the RRG.
On the price chart, in combination with the RRG-Lines, the weakening process is driven by both RRG-Lines moving lower following the raw RS=Line, which has just started a series of lower highs and lower lows.
!!% is the first support level at the top of the big gap-up on 5/25. This gap area is now an important area of support. The bottom of the gap is at 110, which was also the high back in June 2022. Again a notch lower, around 102.50, another horizontal support level shows up.
After breaking these successive resistance levels, AMD jumped to current levels. The uptrend on the longer time frame is fully intact but the near term seems to be getting stretched which also shows from the negative divergence that has been built up between price and RSI.
NVDA
NVDA is tracing out a similar path as AMD. Big gap up, after which price stabilizes, making a shallow new higher high but accompanied by a pretty steep divergence in the RSI. A clear warning sign of a rally running out of fuel.
Here also solid support levels on the way down. The first one is the top of the gap area at around 370 and then the bottom of the gap at 320.
Relative strength stalled at the level of the previous high, and that is pushing the RRG lines lower.
All in all, the same conclusion as for AMD. The long-term trend is still intact, but we may need to prepare for the first serious decline in 2023.
TSLA
TSLA is running into serious overhead resistance with the RSI at extreme levels. No divergence yet but the combination of an RSI at 90 and a price in a heavy overhead resistance area makes the upside potential very limited.
The downside risk, on the other hand, is pretty big. There is a gap area between 230-240 and another horizontal support level around 210.
All in all, the risk/reward potential for new long positions is currently unfavorable. Shorter-term traders can hunt for potential setups moving lower.
NFLX
NFLX is also getting pretty stretched after a steep rally. RSI at very high levels and a vertical move in price. Long-term resistance for NFLX is only found between 465-480, meaning that NFLX has the most upside left compared to the abovementioned stocks.
However, here also, the downside risk is significant. The first support level is only found near 380.
AAPL
AAPL recently broke to new highs, which is a positive signal. However, when I look at relative strength and the RRG-Lines, I have to conclude that other stocks in the NYFANG universe are doing better than the big AAPL.
RS broke horizontal support and is sinking further. The RS-Ratio line on the daily is below 100 but started to move up after relative momentum started to pick up and move above 100. This causes a positive heading into the improving quadrant, but it will take much more (relative) upside to turn this trend around.
AAPL also shows a negative divergence on the RSI, signaling that a pause in the rally or a correction is possible/likely. The downside risk is more limited compared to stocks on the right side of the RRG.
MSFT
Just like AAPL, the relative strength of MSFT is terrible. The recent slow down in the decline is causing the RS-Momentum line to tick up slightly and push the tail into the improving quadrant at a positive heading. But again, a turnaround of this relative downtrend needs a lot more upside (relative) price action.
The price chart is still strong, but this week touched 345, which is the all-time high level, set back in November 2021. Combining that with a negative divergence in the RSI, things look tough to the upside.
The first support levels are showing up around 337 and 322 which is relatively close by compared to the stocks at the other side of the spectrum.
SNOW
SNOW broke above horizontal resistance last week and dropped back to the breakout level this week, but so far, it is holding, which underscores the strength of this stock.
The RS-Line is moving sideways since April of this year, with a sharp dip at the start of June. But things are improving again. This causes a long and powerful tail for SNOW into the improving quadrant on the RRG, making it a stock to keep on your watchlist.
When support around 183 holds next week, this can become a good bouncing board for a new jump toward the next horizontal resistance level between 200-205.
Putting Rotations in a longer-term perspective.
When we put the rotations described above in a longer-term perspective on the weekly RRG, we can make some interesting observations.
NVDA and AMD have just hooked back up inside the weakening quadrant. This suggests they are still leading stocks in this universe and that the weakness, as seen on the daily charts, must be considered temporary for now. Potentially finding new buying opportunities at lower levels.NFLX and TSLA, which are showing strength on the weekly RRG, are showing some short-term weakness inside the leading quadrant on the daily RRG. This is understandable after the moves out of lagging into improving on the weekly RRG. Here also, we are probably seeing a temporary pause, and new buying opportunities are possible at lower levels. Given the position of NFLX and TSLA on the RRG, the upside potential for these two is likely to be bigger.AAPL and MSFT tails have rotated back down inside the improving quadrant. The positive tails seen on the daily RRG are, therefore, most likely only temporary in nature. The break to new highs for AAPL and MSFT pushing toward it may not be ignored, and they can turn their current relative weakness around but most likely only after a setback.The only stock in this universe with confirming tails is SNOW. On the weekly RRG, the long tail pushes hard into the improving quadrant on improving RRG-Heading. And a similar trajectory is playing out on the daily RRG. This makes SNOW one of the more interesting stocks in the NYFANG(sta) paradise.
#StayAlert and have a great weekend. –Julius