
One of my favorite parts of hosting a show on StockCharts TV is being able to interview analysts, traders, and money managers with all sorts of different backgrounds.
Recently, I was asked in our mailbag segment about why and how my guests can have very different takes on the markets at any given moment. The reality is that even though we all use a similar toolkit, our backgrounds and life experiences and professional trajectories are all embedded somewhere in our analysis. Whether we like it or not, who we’ve been up until now most likely affects how you’re analyzing the charts.
And sometimes the evidence is just, well, cloudy. Much like the weather in Redmond, Washington, volatility and uncertainty are just part of the picture. I feel I’ve gained so much over my career by actively engaging those with a different perspective, as it’s forced me out of my own narrative and allowed me to consider other points of view. So when I see the S&P 500 index bumping against the “ultimate resistance level” around 4300-4325, I can’t help but consider some different potential future paths.
So what may come next for the S&P 500?
First, let’s set the stage.
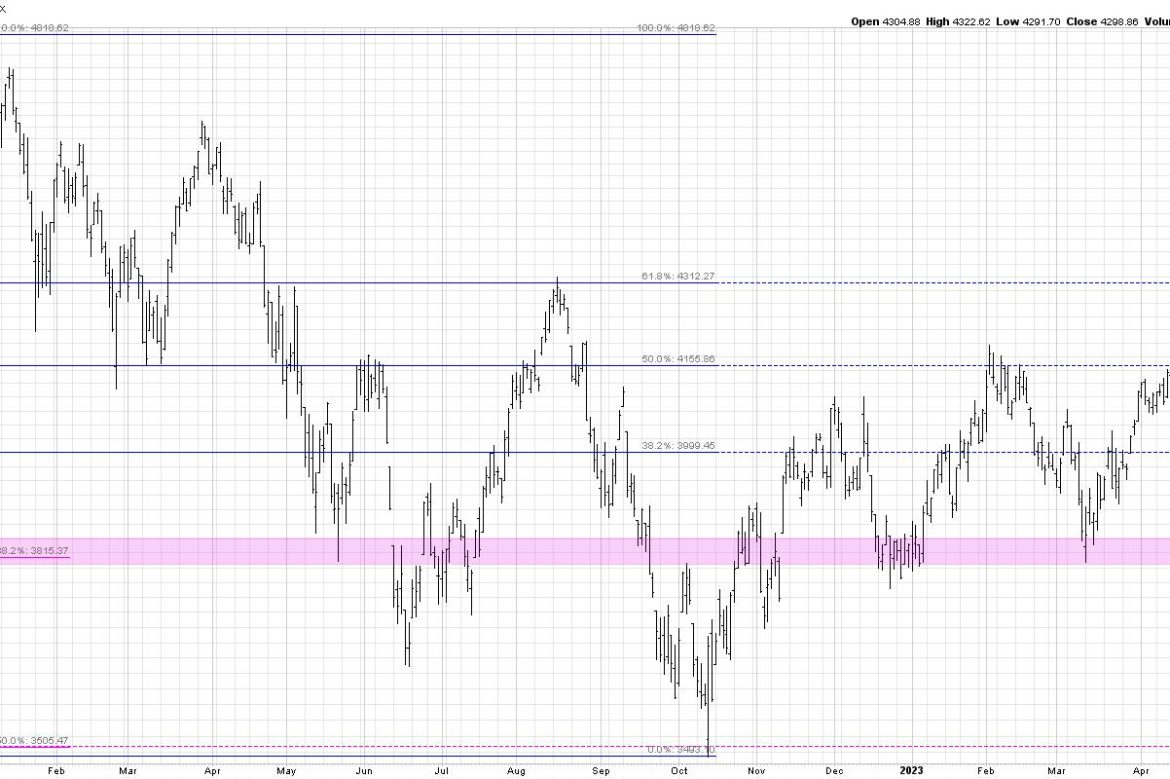
If we consider the 2022 bear market phase as the framework for a Fibonacci analysis, we come up with three important levels to watch. First, the 38.2% retracement level hits right around 4000, which was first reached in November and preceded the drop down to the December low around 3800. Second, the 50% level is right around 4155, which was pretty much where the February 2023 high ended up; note how many times we tested this level during the congestion phase in April and May!
That brings us to this week, where we have now tested the 61.8% level for the first time since the August 2022 high. If you were wondering why so many are focused on the 4300 level for the S&P 500, this chart should make it pretty clear!
Now we’ll lay out four potential scenarios for the S&P 500 over the next six to eight weeks. And remember the point of this exercise is threefold:
Consider all four potential future paths for the index, think about what would cause each scenario to unfold in terms of the macro drivers, and review what signals/patterns/indicators would confirm the scenario.Decide which scenario you feel is most likely, and why you think that’s the case. Don’t forget to drop me a comment and let me know your vote!Think about each of the four scenarios would impact your current portfolio. How would you manage risk in each case? How and when would you take action to adapt to this new reality?
Let’s start with the most optimistic scenario, involving a strong summer push for stocks.
Scenario #1: The Super Bullish Scenario
What if the great bull market of 2023 is just getting started? Let’s say Apple doesn’t stop, pushing to a new all-time high and even higher. The mega-cap growth trade which has worked for most of 2023 just keeps working.
In this scenario, 4300 recedes in the rearview mirror and pushes above 4600. We may even see new all-time highs for the S&P 500 index! Breadth conditions improve as pretty much everything is pulled along for the ride. Onward and ever upward!
Scenario #2: The Mildly Bullish Scenario
What if the mega cap growth stocks remain strong, but the pace of the uptrend slows considerably? Charts like AAPL and MSFT pull back as investors digest the gains they’ve enjoyed in these winning stocks in 2023. Value-oriented sectors like Energy and Financials may do well in this scenario, but, because the leadership has changed away from the growth sectors, it means limited upside for our growth-oriented benchmarks.
In this scenario, the S&P 500 does break above 4300, but does not get much further beyond that. Bulls are frustrated but still doing okay, and bears begin to really question their sanity.
Scenario #3: The Mildly Bearish Scenario
What if 4300 holds and this ends up being the top until the fall months? The mildly bearish scenario would mean that the mega growth trade chills out in a major way, and the market goes into profit-taking mode.
Perhaps we find the inflation data next week is way higher than expected, and the market gets a short-term downside shock. What’s interesting here is the S&P 500 could go all the way down to around 3800, remain above the March low, and still put in a higher low. This mildly bearish scenario may just be a pullback within the context of a long-term bull phase in 2023, but the next couple months are a little rough.
Scenario #4: The Super Bearish Scenario
Here’s where things get very hairy very quickly. What if there is a downside shock of sorts, causing the Fed to take drastic action that pushes risk assets lower? Investors rotate quickly to defensive positions, but this creates a feedback loop of bearishness. Fear of losing everything takes hold and investors go into a full-on fetal position.
Gold rips to the upside as “rocks over paper” becomes the trade of the year. The entire game plan for the Fed is brought into question and we’re left wondering what happened to the great bull market of 2023. 3800 comes and goes and we are talking again about retesting the October 2022 lows around 3500-3600.
Okay, so have you decided which of these four potential scenarios is most likely based on your analysis? Head over to my YouTube channel and drop a comment with your vote and why you see that as the most likely outcome.
And don’t forget to think through all the other scenarios as well. Only by stretching out of our comfort zones and considering other points of view are we able to better handle whatever the future may actually hold!
RR#6,
Dave
P.S. Ready to upgrade your investment process? Check out my free behavioral investing course!
David Keller, CMT
Chief Market Strategist
StockCharts.com
Disclaimer: This blog is for educational purposes only and should not be construed as financial advice. The ideas and strategies should never be used without first assessing your own personal and financial situation, or without consulting a financial professional.
The author does not have a position in mentioned securities at the time of publication. Any opinions expressed herein are solely those of the author and do not in any way represent the views or opinions of any other person or entity.