
After a huge rally off the March lows, the first full week of June saw the markets move sideways for the most part. At noon on Friday most US indexes were up marginally on the week. The charts below are all 60 minute charts.
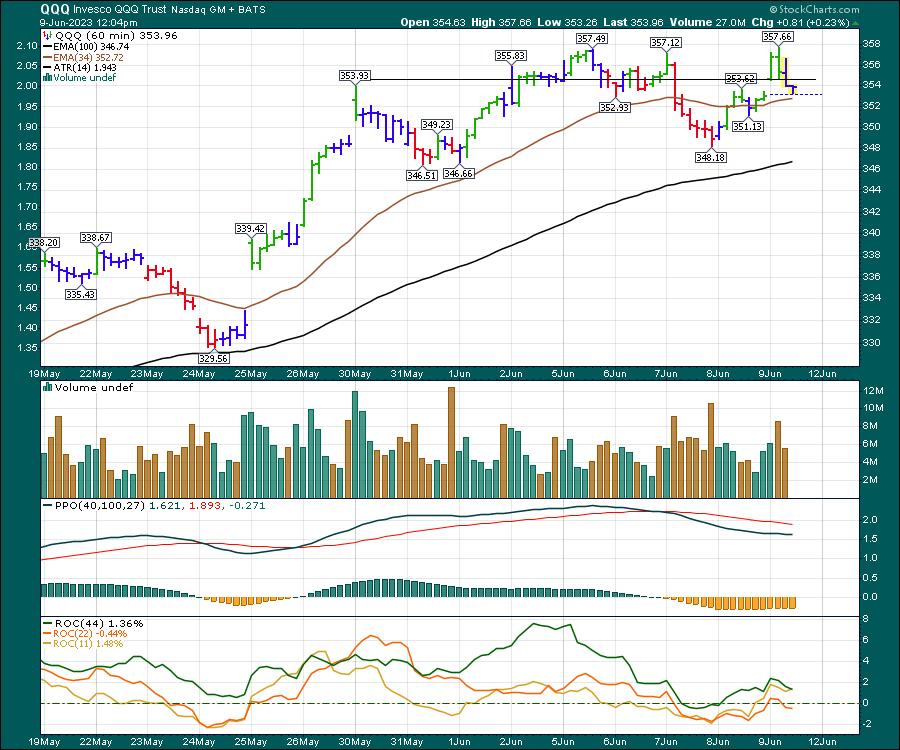
Nasdaq 100 (QQQ)
The black line represents last Friday’s close. The Nasdaq 100 had surged up to this level to start the prior week, so the advance by the top 100 is pausing at this point. Consolidation is warranted after a heady advance.
The S&P 500
The SPY is trying to point north. At noon it was up 1/2% on the week. It is up a little more than the Nasdaq and breadth within the 500 stocks is still positive.
Dow Jone Industrial Average
The DIA was up 0.20% on the week at noon. A steady climb from Tuesday’s low helped the index get back on positive ground for the week. The chart has accelerated nicely from 2 weeks ago.
Russell 2000 (IWM)
The IWM has been the story for two weeks and it definitely played catch up. It was up 9.4% from the low two weeks ago to this weeks high and up 1.96% from last Friday’s close as of noon Friday.
The $TSX (XIU.TO) (Canada)
The Canadian market is down 0.67% at noon on Friday and the chart is not enjoying the buoyancy shown in the USA. The sideways performance over the last three weeks demonstrates the difference between the markets. One significant difference for the USA is the number of technology stocks. While the Russell 2000 has lots of banks, industrials, materials and energy names that perked up this week, it seems the Canadian market missed the same thrust outside of technology on the Canadian exchange.
The big boosters in the USA have been semiconductors and software over the last two months.
Semiconductors
SMH is a semiconductor ETF. Flat over the last two weeks, this chart tried to break out to the upside this morning and is definitely one to watch. Many of the semiconductor names are either forming bull flags or distribution.
Software
IGV is a software ETF. There are many to choose from, but I’ll use IGV. It is flat from last week and flat from the Tuesday morning surge on May 30th.
While there are still stocks going higher, it is starting to look like the sideways consolidation is taking place. Watch closely to see which way this resolves.
If you would like to see more of what we do at Osprey Strategic, we offer a $7 trial for the first month where you can look through our videos and newsletters from the past few weeks as well.